Knowledge. Shared Blog
September 2020
In Charts: U.S. Stock Performance During Past Presidential Elections
Although elections introduce uncertainty, historically, U.S. stocks have tended to finish in positive territory over the months leading up to and after a U.S. presidential race. But this year’s contest comes with plenty of unknowns and takes place during a global pandemic, creating ample opportunity for short-term volatility.
Key Takeaways
- Since 1960, the S&P 500® Index has delivered gains 80% of the time over the months leading up to a U.S. presidential election.
- Immediately following the election, the S&P 500 has tended to be flat or in positive territory. One notable exception was in 2000, when a vote recount delayed the election outcome.
- With this year’s election taking place during the COVID-19 pandemic, stock performance has been far from typical, and markets could experience heightened volatility as Election Day nears. But in the end, earnings tend to drive long-term returns.
With the U.S. election on Nov. 3 drawing closer, investors may be wondering what to expect from markets. Although stocks typically dislike the uncertainty that is inherent to elections, since 1960, the S&P 500® Index has delivered gains 80% of the time over the months leading up to a presidential election. Among up years, the biggest returns were experienced in 1980, when Ronald Reagan was first elected. Among down years, the sharpest contraction occurred during the Global Financial Crisis (GFC) in 2008, when Barack Obama became president. But generally, stock returns have tended to be positive preceding a presidential election, regardless of the eventual winner.
[caption id=”attachment_319908″ align=”alignnone” width=”600″]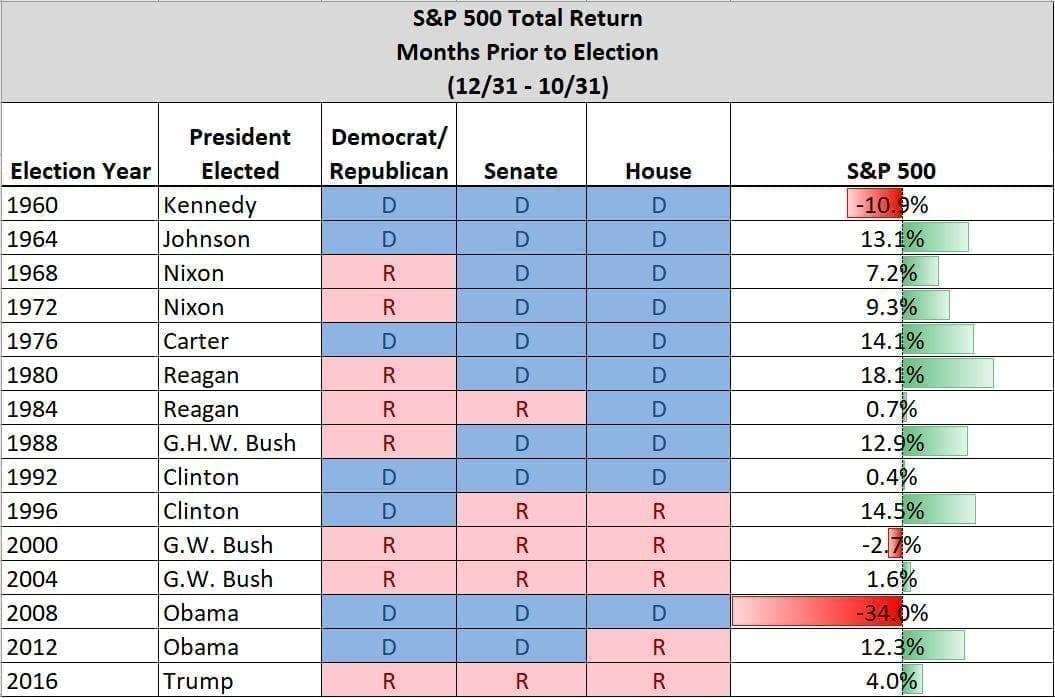 Source: Bloomberg[/caption]
The last time Americans went to the polls during a global pandemic was in 1918 during the Spanish flu outbreak, making this election year hard to judge by history. Not surprisingly, equity performance has been erratic. In March, the S&P 500 endured the swiftest bear market on record as the COVID-19 pandemic accelerated, with the index falling more than 30% in just over a month.1 Not long after, the S&P rebounded, hitting a record high in late August – only to retreat in September on worries about a resurgence in coronavirus cases and a stalemate in Washington, D.C., over additional economic relief.
Year-to-Date Market Performance and Volatility
[caption id=”attachment_319920″ align=”alignnone” width=”650″]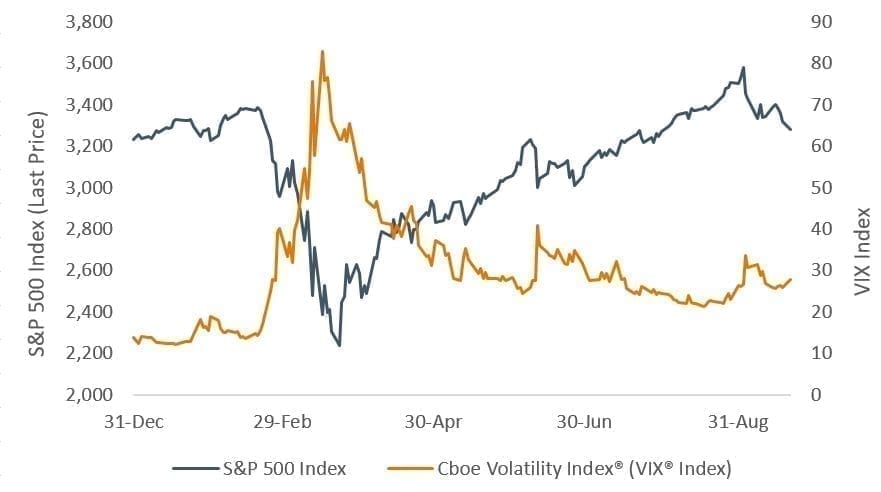 Source: Bloomberg, from 31 December 2019 to 21 September 2020. Cboe Volatility Index is a calculation designed to produce a measure of constant, 30-day expected volatility of the U.S. stock market, derived from real-time, mid-quote prices of S&P 500 Index call and put options. S&P 500® Index reflects U.S. large-cap equity performance and represents broad U.S. equity market performance.[/caption]
Past Post-Election Performance
Market gyrations can increase as Election Day nears, as well as during the hours, days or weeks immediately following the vote. But pullbacks are often short-lived, with indices typically ending flat or in positive territory over the last two months of an election year. One notable exception occurred in 2000, when a vote recount in Florida delayed the outcome of the presidential race by a month (with a Supreme Court case ultimately determining the winner). Worries exist that something similar could happen this year should mail-in voting, necessitated by COVID-19, complicate the tallying of votes or lead candidates to contest the final count.
Control of the Senate is proving to be just as important – and unpredictable – as the presidential bid, especially after the passing of U.S. Supreme Court Justice Ruth Bader Ginsburg. Both President Trump and Democratic nominee Joe Biden need a Senate majority to make sweeping legislative changes as president. With the court’s liberal-conservative tilt hanging in the balance, both parties argue the fight to fill Justice Ginsburg’s seat will energize voters, making Senate races all the more competitive.
[caption id=”attachment_319814″ align=”alignnone” width=”640″]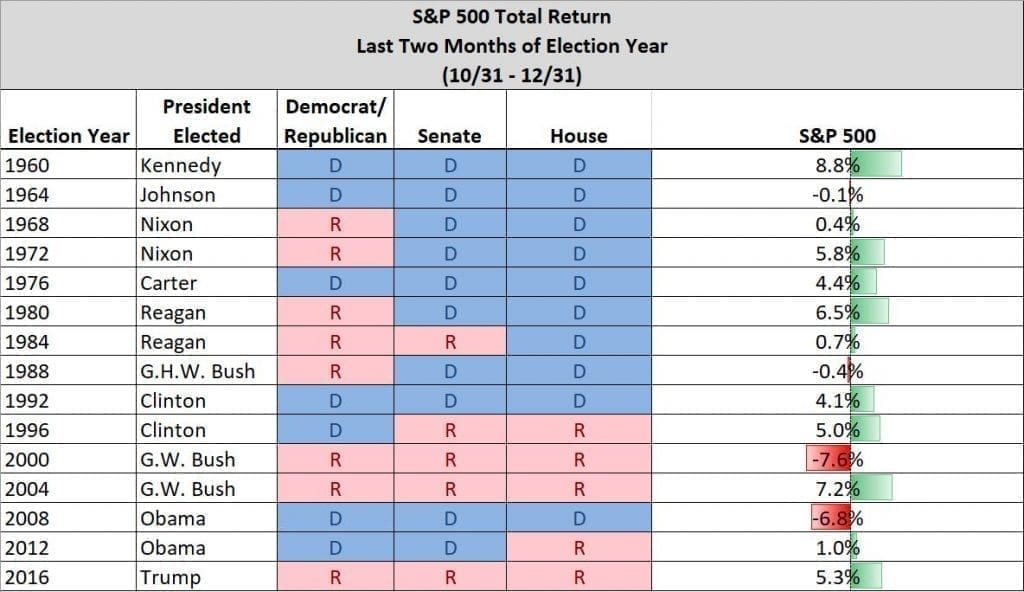 Source: Bloomberg[/caption]
Historical Sector Performance
Looking at sector performance, since President Bill Clinton was first elected in 1992, health care and technology have more often experienced losses in the lead-up to a presidential election. Most other sectors have tended to be positive (again, with 2008 being an exception due to the GFC).
[caption id=”attachment_319931″ align=”alignnone” width=”800″]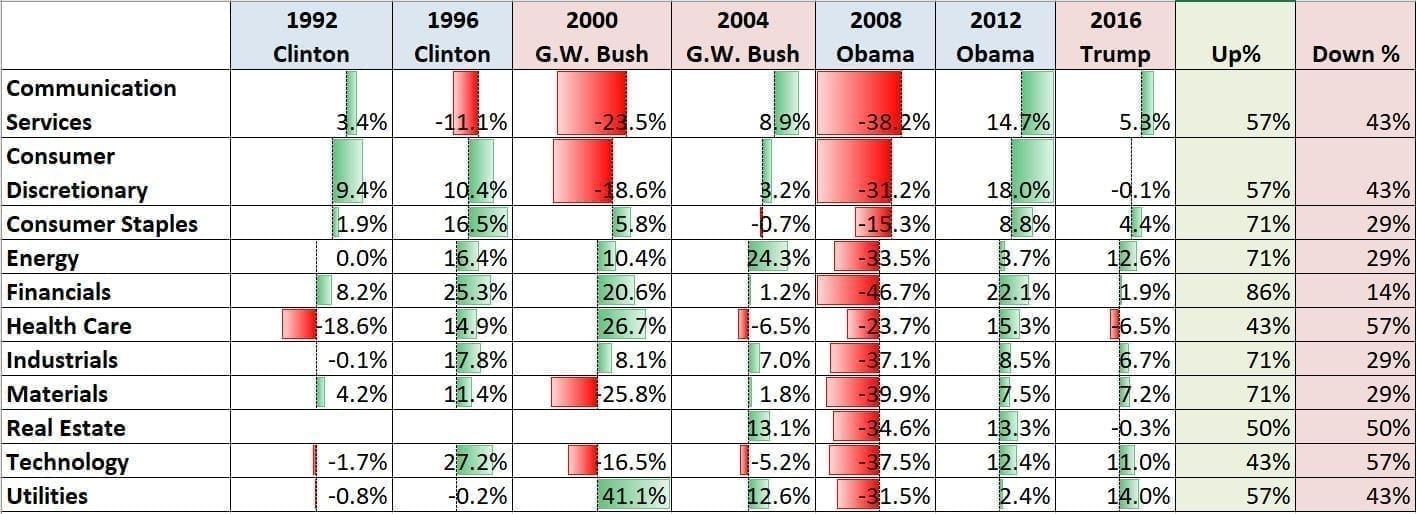 Source: Bloomberg. Each S&P 500 sector comprises those companies included in the S&P 500 that are classified as members of the respective GICS® sector.[/caption]
2020 Sector Performance
This year, technology stocks have seen double-digit gains as social distancing measures accelerated the pivot to a digital-first economy and as investors favored companies whose revenues are less dependent on economic growth.
For health care, the story has been more mixed. Year to date through September 21, the Nasdaq Biotechnology Index rallied more than 10% as investors rewarded companies developing vaccines and therapies to address COVID-19. However, other areas of the sector, such as hospitals and medical device makers, have seen demand disrupted due to the pandemic. Political uncertainty also continues to buffet the sector, with both presidential candidates calling for lower drug prices and the Trump administration joining a Supreme Court case to invalidate the Affordable Care Act, the decade-old legislation that expanded health care access in the U.S. The Supreme Court is set to begin hearing the case November 10, with the ruling now made more uncertain by Justice Ginsburg’s death.
Year-to-Date Total Return
[caption id=”attachment_319897″ align=”alignnone” width=”600″]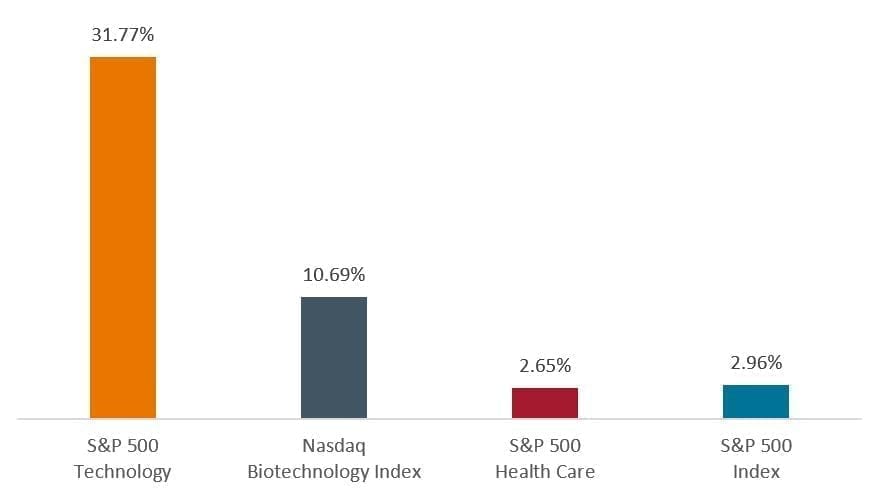 Source: Bloomberg, data from 31 December 2019 to 21 September 2020. Nasdaq Biotechnology Index contains securities of Nasdaq-listed companies classified according to the Industry Classification Benchmark as either Biotechnology or Pharmaceuticals which also meet other eligibility criteria.[/caption]
The Long View
Importantly, while markets might experience heightened volatility around the time of the election, over the long term, stocks have tended to be resilient irrespective of election outcomes. Since 1960, the S&P 500 has been up more times than it’s been down over the 12 months following an election. The removal of election uncertainty and the realization that significant policy change takes time could help explain this buoyance.
Typical of this election period, the direction of stocks after November may not be straightforward and will likely depend on several factors, including the trajectory of the pandemic, global economic growth, fiscal and monetary stimulus, and election results. Which will matter most? In the end, it usually comes down to earnings. As investor Benjamin Graham is said to have noted, in the short run the market is a voting machine, but in the long run it is a weighing machine. In other words, markets are susceptible to investor emotions, but long term, earnings and other fundamentals drive returns.
[caption id=”attachment_319943″ align=”alignnone” width=”575″]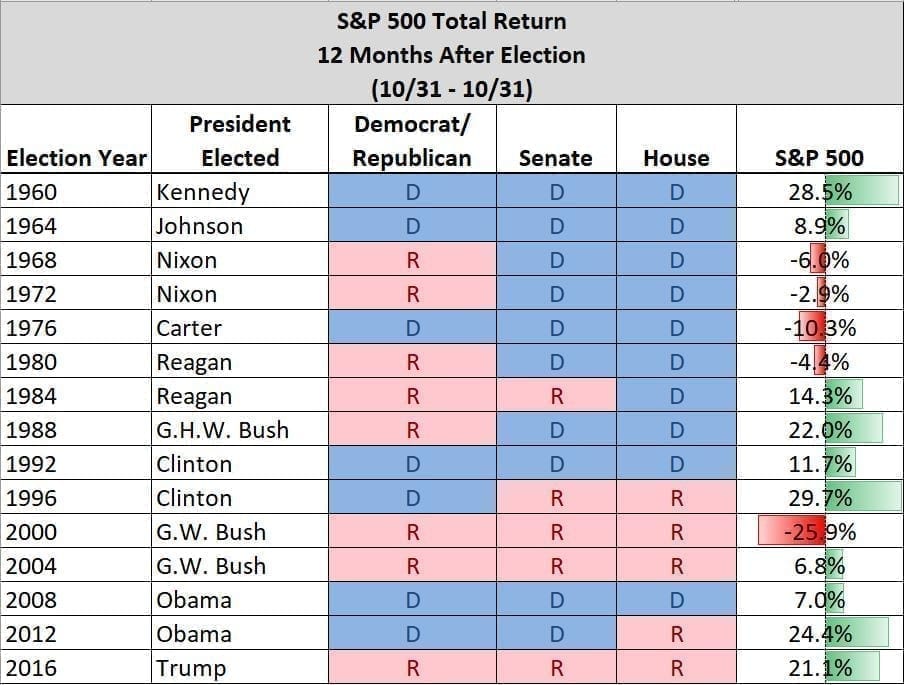 Source: Bloomberg[/caption]
1A bear market is a decline of 20% or more. The S&P 500 peaked on February 19 and fell 34% before bottoming on March 23.
Source: Yardeni Research, as of 21 September 2020.
Knowledge. Shared
Blog
Back to all Blog Posts
Subscribe for relevant insights delivered straight to your inbox
I want to subscribe