Subscribe
Sign up for timely perspectives delivered to your inbox.

Global industrial output may already have executed a perfect V. The G7 plus E7 aggregate calculated here plunged 17.7% from a December high to an April low but had retraced 87% of the decline by July. A further 2.3% rise is needed to regain the December level, which is likely by this month and may even have occurred in August, in which case each side of the V would have taken four months to complete. (Output rose in August in the US, China and Russia, while a jump in Japanese export volumes points to an increase there.)
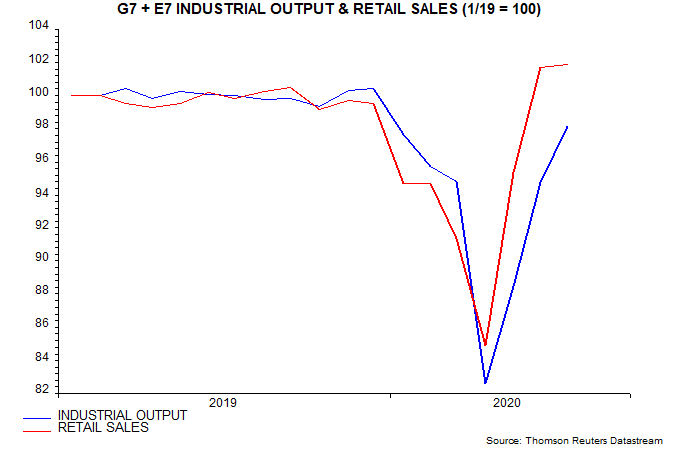
The output rebound reflects an even stronger rise in consumer goods demand, which has traced out a reversed italic V. G7 plus E7 real retail sales reached a new record in June, rising slightly further in July (and probably August, based on US / Chinese results).
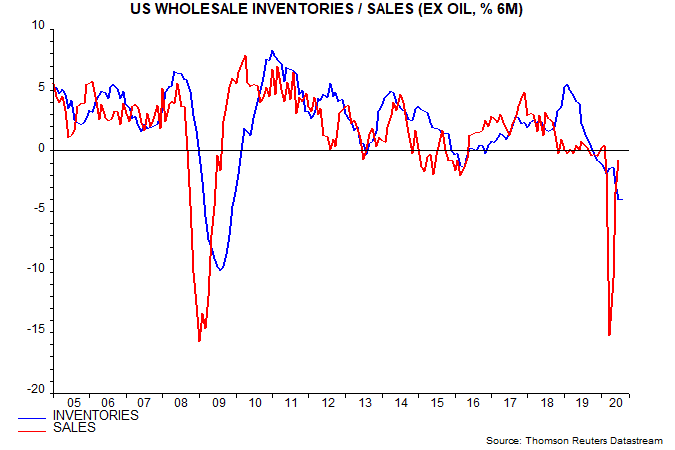
A restocking boost to output is now under way as companies attempt to reverse unanticipated inventory depletion due to demand resilience and lost production. The six-month change in US wholesale sales moved above the corresponding inventories change in July, echoing a crossover in May 2009 – second chart. Stockbuilding contributed 2.5 pp to US GDP growth over the four quarters to Q3 2010.
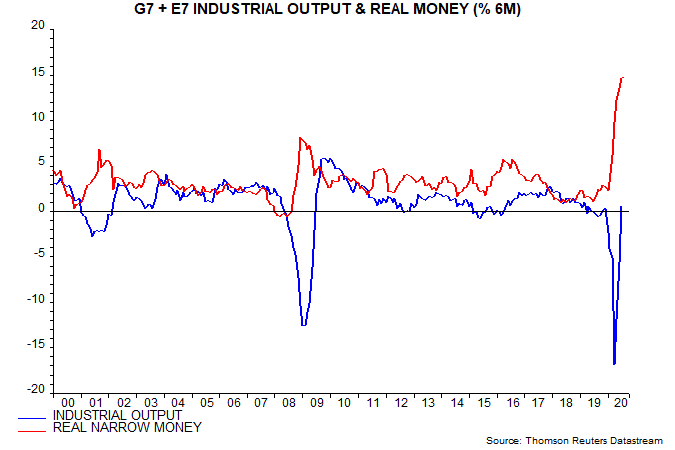
Industrial output momentum is moderating as the prior peak is reached but monetary trends suggest strength through Q2 2021, at least. G7 plus E7 six-month real narrow money growth appears to have reached a marginal new high in August, based on partial data – third chart. Base effects will ensure a fall from September but the usual nine-month lead implies no significant output slowdown until after May 2021.
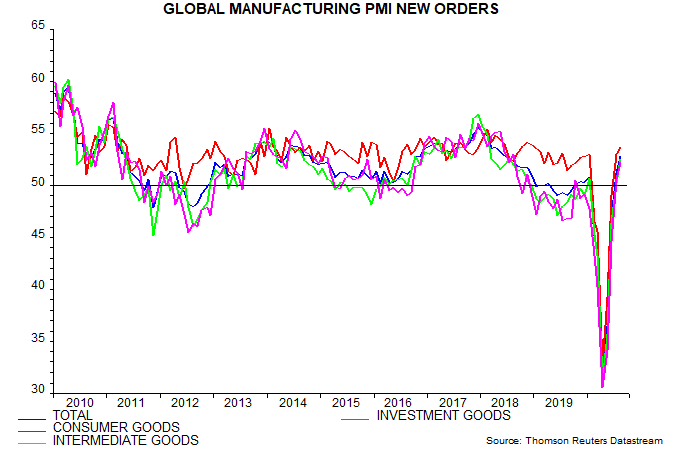
Pessimists expect output to relapse as profits damage feeds through to capital spending weakness and job losses. Profits, however, are rebounding with output and business capex almost certainly bottomed in Q2: G7 capital goods output was up by 34.3% from an April low in July while the global manufacturing PMI investment goods new orders index hit a two-year high in August – fourth chart. A Q2 low was the latest compatible with the 7-11 year Juglar cycle, which previously troughed in Q2 2009.
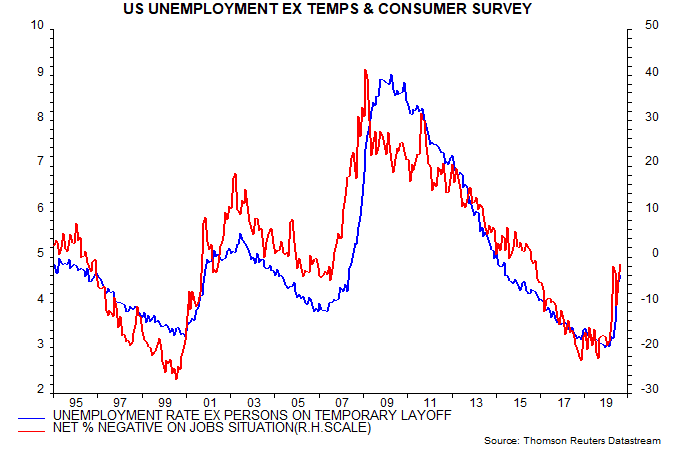
The next surprise – following confirmation of a V recovery in profits and capex – could be the speed of recuperation of labour markets. The US “permanent” unemployment rate (i.e. excluding those classified as temporarily laid off) remains low by historical standards at 4.6% in August, consistent with Conference Board consumer survey results showing only moderate negativity about current labour market conditions and prospects – fifth chart.
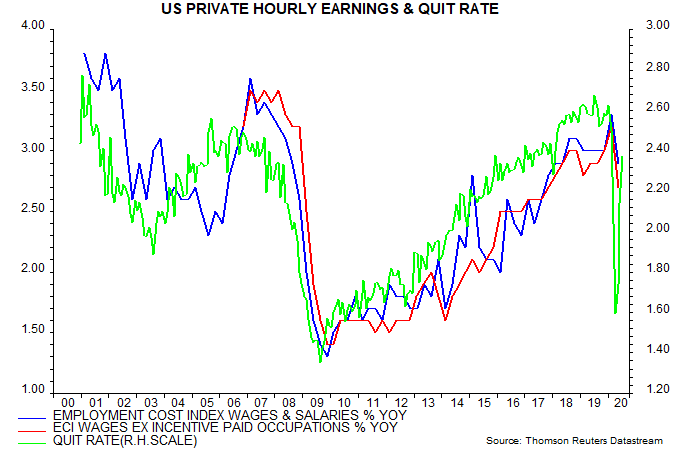
The voluntary quit rate, meanwhile, has recovered surprisingly strongly from a January-April plunge – sixth chart. The quit rate, under normal conditions, is a gauge of alternative job opportunities and workers’ ability to demand higher wages. Job openings have also rebounded.
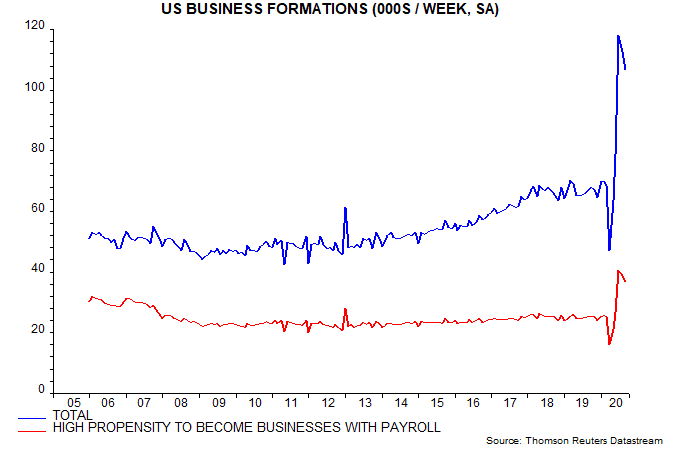
A speculative hypothesis is that the covid shock has triggered a burst of entrepreneurial activity, which is speeding labour market adjustment and recovery. US business formations have surged, according to Census Bureau experimental data, including of entities assessed as having a high propensity to create jobs – seventh chart. UK new incorporations were also unusually high over June-August, according to Mobunti.