Subscribe
Sign up for timely perspectives delivered to your inbox.
Wise men and women from years past have admonished us to ask the right questions to gain knowledge, to increase wisdom and to solve problems big and small confronting us. Ask the right question and you are more than halfway to solving the problem. Easier said than done in the current environment. Today, many are unsure of what questions should be asked or whether we are asking the right questions in the first place. In May, Jim Cielinski – our Global Head of Fixed Income – had the following missive for institutional investors:
“In today’s period of genuine uncertainty where the answer to many critical investment-related questions is binary, asking the right questions … will be essential to navigating the investment landscape.” 1
We, finance professionals, struggle with uncertainty because we are used to dealing with risk, not uncertainty. We struggle with uncertainty because no amount of historical data analysis or econometric models will inform us about how the future will unfold or how it will impact the price of financial assets. In our collective struggle against pandemic-induced uncertainty, we have curated below some of the commonly asked questions, answers to which may or may not result in changes to the overall investment strategy for institutional investors in a COVID laced and debt-laden world.
The foregoing list is by no means exhaustive and readers of this paper can easily add another dozen or so more questions. But, strictly from an institutional asset owner’s perspective, are they the right questions we should be asking?
The investment objective for most, if not all, institutional investors is to maximize the plan level return per unit of risk taken, not per unit of uncertainty. While thought provoking and interesting to debate, I am not sure how much impact they will have on maximizing plan level returns because most of the questions posed above are macro in nature and extremely difficult – if not impossible – to forecast and time correctly. And, above all else, they do not answer the ultimate question: “So what?” It may take years for us to find answers to some of the questions and answers may become clear only after the fact. Even when we do have the answers to those questions, we are not certain what impact they will have on investment strategy at the overall plan level.
In what follows, we question a number of the questions themselves to discern whether, in our opinion, they represent the right questions plan sponsors should be asking to maximize returns for their respective portfolios.
At the beginning of June, as lockdowns began to ease in different parts of the country, the U.S. stock market behaved as though we expected a V-shaped recovery. Exhibit 1 demonstrates the path of the S&P 500® Index since the beginning of the year.
Indeed, the pattern of the S&P 500 Index definitely looks like a V, but it appears to be forming the beginnings of a square root sign. So, what are the implications of that? What should plan sponsors do with this information? Do they time the market and decrease the equity allocation because equity returns will be flat for the foreseeable future? If they decrease their equity allocation, to what asset class do they deploy the proceeds from equities? In our opinion, this is a question with little to no actionable value; that is, whose answer has no discernable effect on how institutional investors should manage their portfolios going forward.
“Unprecedented” was one of the most commonly used words to describe the speed of the fall in equity markets. In Exhibit 1, one can appreciate how fast equities fell in March when compared to the 2008 Global Financial Crisis and the 2000- 2002 TMT Bubble.
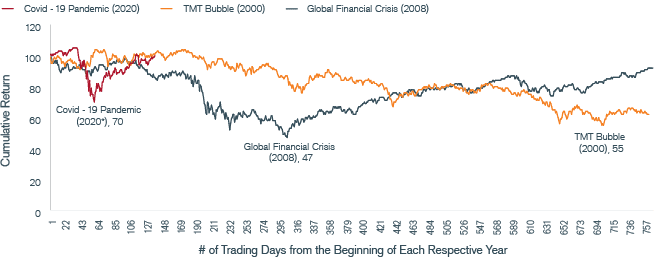
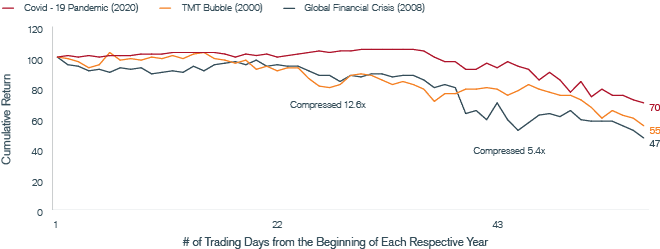
In Exhibit 2, we compressed the equity sell-off timelines of the 2000-2002 TMT Bubble and the 2008 Global Financial Crisis to match the equity sell-off witnessed during the first quarter of 2020. The speed of the recent equity sell-off was 12.6 times faster than the TMT Bubble and 5.4 times faster than the Global Financial Crisis. Although truly unprecedented in speed, the loss of capital was not as severe as the previous two equity sell-offs: The S&P 500 Index lost 30% between January 1 and March 23, 2020, 45%2 in the aftermath of the TMT Bubble and 53%3 during the Global Financial Crisis.4
George Maris, our Co-Head of Equities for Americas, reflected on the speed and severity of the equity sell-off:
“The drawdown was remarkable for its speed and ferocity and was likely amplified by market structures known as algorithmic, or model-driven, trading strategies … by our estimate [they] now make up some 60% of all trading activity, use computer models to buy or sell stocks based on factors such as risk parity, momentum, liquidity or volatility. … As the outlook for 2020 abruptly changed and market dynamics shifted, these models triggered swift and intense selling to try to keep portfolio characteristics within predefined ranges.” 5
In hindsight, given the sharp rise in unemployment, the collapse in aggregate demand, uncertain corporate earnings prospects and changes in equity market structures, the speed and the severity of the fall makes sense; however, reasons for the speed and severity of the fall do not exactly inform how plan sponsors should alter their future asset allocations or their investment strategies. We know large equity losses are not so uncommon and the speed of the equity drawdown appears to be accelerating. And absent perfect foresight, most cannot anticipate a fall in equities. Therefore, perhaps a more appropriate question for plan sponsors to ask is:
What is my strategic allocation to assets and investment strategies that will protect and generate positive returns (i.e., positive convexity strategies) when equities sell off sharply?
The “market of stocks” refers to the narrow breadth of winners in equity markets. As demonstrated in Exhibit 3, since the beginning of the year, FAANG6 + Microsoft (MSFT) + Tesla (TSLA) has dominated the broader market indices: it has outperformed the S&P 500 Index by roughly 30 percentage points and the MSCI World ex USA Index by 38 percentage points.
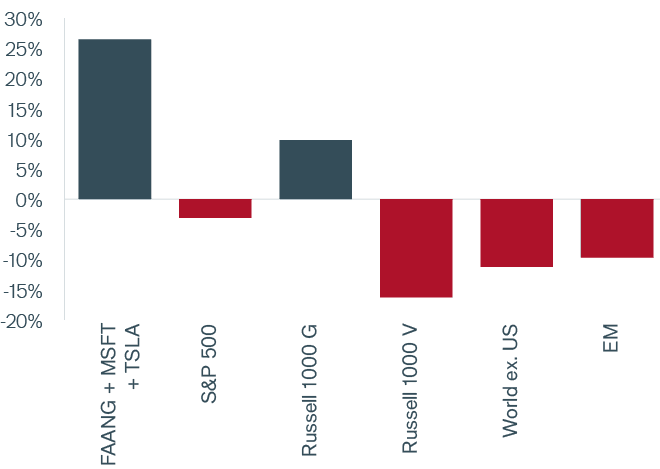
Source: Bloomberg, MSCI, Janus Henderson Investors Analytics. As of June 30, 2020.
And due to the stratospheric rise in their share prices, the combined market capitalization of these seven stocks is greater than the entire market capitalization of the European Union, China or Japan.

Source: MSCI, Janus Henderson Investors Analytics. As of June 30, 2020.
What we are witnessing is a bit reminiscent of the rise of technology stocks between 1998 and February 2000 before their eventual fall. It feels a bit bubbly. While the foregoing statistics are interesting, we are not sure what to make of the “market of stocks.” On their own, there is very little to no actionable information content.
At the end 30 June 2020, FAANG + MSFT + TSLA accounted for 32.5% of the Russell 1000® Growth Index. When averages for the broader market indices are skewed and driven by a handful of stocks, active equity managers face a tough choice with respect to their portfolio positioning. For example, as a large-cap active growth manager, how much does one deviate from the FAANG + MSFT + TSLA cohort, especially when underweighting or not owning one or more of these stocks may result in protracted underperformance versus the benchmark?
As the second quarter review unfolds, investment committee members may find an inverse relationship between the level of active share and relative performance: on average, the lower the active share (i.e., less deviation from the benchmark) the higher the relative performance versus the benchmark and vice versa. Cautious active managers, those that intentionally chose to materially deviate from their respective benchmarks due to stratospheric valuation in some segments of their markets (i.e., higher active share managers), most likely underperformed year-to-date 2020.
Therefore, in this market of stocks environment, deeper level questions to ask may be:
How are active managers positioning their portfolios against the “market of stocks”? And do their investment results make sense after accounting for their intentional deviations from their respective benchmarks?
Monetarists would answer “yes” to the foregoing question; however, at least within Janus Henderson Investors, there is a healthy and reasoned debate going on among fixed income and equity investors on the future path of inflation, with both sides providing compelling arguments.
It is highly improbable the U.S. dollar – with the global reserve currency status – will meet the same fate as the Ecuadoran sucre anytime soon (see callout box on next page). Moreover, given the money printing press has been running at full steam in all major economies around the globe, it is unlikely the U.S. dollar will materially depreciate against other major currencies
What seems certain is that no one knows for sure if and when inflation will rear its ugly head. Given this uncertain backdrop, we question the value of attempting to divine whether we should expect higher inflation in the future. Conviction levels associated with answers for and against higher inflation are simply too low to induce any investment decisions.
Having grown up in Ecuador and witnessing firsthand what high inflation can do to destroy one’s wealth, this question is very dear to my heart. My family immigrated to Ecuador from Korea in April 1979. Back then, one dollar would buy between 27 to 30 sucres – the local currency shown below that is no longer in circulation.

In the early 1980s, when the sucre began to depreciate due to rising inflation, my father withdrew all his cash holdings, packed his briefcase with stacks of bills and headed directly to a casa de cambio, where he promptly sold all his sucres for U.S. dollars at an exchange rate of 43 sucres to a dollar. His briefcase was much lighter when he exited the casa de cambio. By the time Ecuador adopted the U.S. dollar as its official currency at the end of 2000, the government had fixed the exchange rate at 25,000 sucres to 1USD – a loss of 99.9%. In hindsight, my father was a genius or incredibly lucky for exchanging his sucres at 43 to 1 USD.
Some have resorted to holding gold, less as an inflation hedge and more as a hedge against uncertainty and as an ultimate reserve currency in the face of ever-increasing supply of fiat currencies. But for those who are unwilling to hold gold (a non-income generating asset), since unexpected inflation can wreak havoc on both equities and bonds, perhaps a better question to ask would be:
What is my exposure to assets or investment strategies that will protect and generate positive returns (i.e., positive convexity strategies) during tail events – when both equities and bonds experience coincident sell offs due to a sharp rise in inflation?
Although difficult to ascertain, we believe the foregoing is a good question because it will have wide-raging implications for asset prices in investment-grade and high-yield credit, bank loans and private debt – all strategic asset classes within institutional portfolios. And albeit hard and time consuming – different from thematic questions such as “Has the pandemic accelerated the ‘Digitization of Everything?’ ” – firms with proper depth and breadth of resources can analyze and quantify the range of potential corporate defaults and recoveries for the next several years through companylevel fundamental credit analysis.
As an example, at 30 June 2020, the yield-to-worst (YTW) on the US High Yield Index7 stood at 6.87%. This YTW statistic does not include expected defaults and recovery rates. According to Horizon Actuarial Services Survey of Capital Market Assumptions8, the long-term expected return on high yield (after accounting for defaults and recoveries) was estimated at 5.1%. Roughly, the difference between the two (1.77%) represents annualized losses associated with defaults adjusted for recoveries. Purely from an informational standpoint, Exhibit 5 presents the historical corporate credit default rates since 1920.
As remarked earlier, questions related to corporate defaults and recoveries are very relevant to institutional investors because they have a direct bearing on whether investmentgrade credit, high yield, bank loans or private debt represents attractive investments going forward.
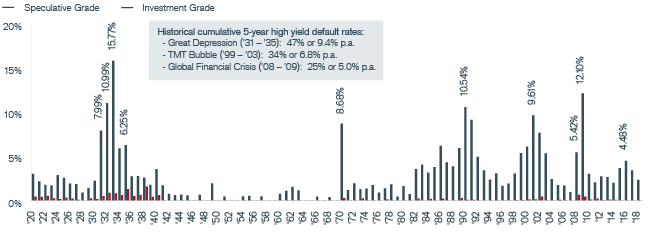
Source: Moody’s Investor Services, Janus Henderson Investors Analytics. Annual Data from 1920 to 2018.
Ash Alankar, Portfolio Manager on our Adaptive Asset Allocation strategies, is fond of quoting Philip Anderson, 1977 Nobel Prize recipient in Physics.
“Much of the real world is controlled as much by the ‘tails’ of distributions as by means or averages; by the exceptional, not the mean; by the catastrophe, not the steady drip. … We need to free ourselves from ‘average’ thinking.”
Market averages mask the great divide between the market of stocks and the rest of the stock market. Broad market indices have risen on the back of a very select group of exceptional companies and government responses. And the speed and shape of the recovery in both equity and fixed income market indices belie the persistent dark cloud coverings over financial markets.
To maximize returns on plan assets, investors must ask relevant, deeper-level questions, not the commonly asked questions with little to no actionable information content. Ask the right question and you may be more than halfway there to solving problems at hand. And don’t forget to free yourself from average thinking.
The Institutional Client Strategy Team (CST) is committed to sharing Janus Henderson’s research and overall views on investment strategy, asset allocation and trends in institutional investing. CST regularly publishes articles and white papers relating to timely market events and future trends, as well as relevant and actionable insights relating to portfolio construction and asset allocation decisions.
In addition, CST regularly performs customized analyses to understand the underlying sources of risk and return in a portfolio, inform capital allocation decisions and measure the performance of the portfolio across different environments to reveal potential sensitivities to specific macroeconomic conditions and events.
1 Cielinski, James. “After the Virus: A Binary World” Janus Henderson Investors, May 2020 Insights.