Subscribe
Sign up for timely perspectives delivered to your inbox.

Cyclical equity sectors excluding tech have outperformed defensive sectors significantly since the March low in markets. Economic prospects and valuations suggest a further relative gain.
A start of year commentary expressed caution on cyclical assets because global monetary trends suggested lacklustre economic growth. Money measures were surging by end-March, warranting a shift to a positive view.
MSCI divides the 11 GICS equity market sectors into “cyclical” and “defensive” categories. The cyclical grouping includes the tech sectors of IT and communication services. These sectors have displayed economic sensitivity historically but recent performance has been driven by structural themes and covid. This suggests separating them out from the other cyclical sectors (i.e. materials, industrials, consumer discretionary, financials and real estate).
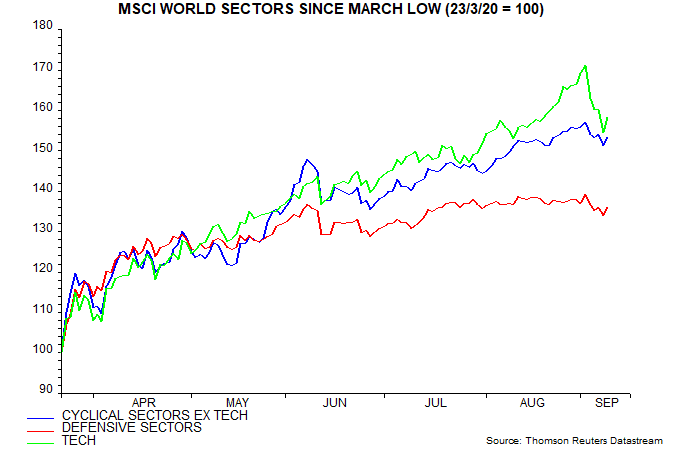
Since a 23 March low in the MSCI World index, cyclical sectors ex tech have rallied by 53.2% in US dollar terms versus a 58.3% rise in tech and only 35.9% in defensive sectors (consumer staples, health care, utilities and energy) – see first chart. The strongest individual sector over this period was consumer discretionary (which includes Amazon) with a 68.3% gain followed by materials and IT at 65.7% and 65.3% respectively.
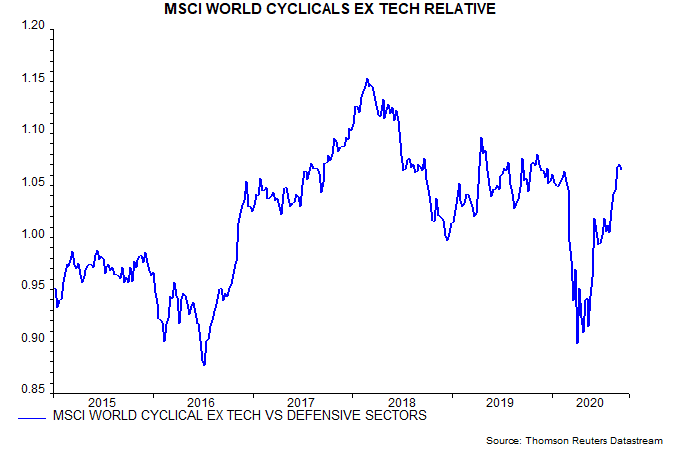
The ratio of the cyclical ex tech and defensive sectors indices has fully retraced the February-April fall, reaching its highest level since November – second chart
This ratio correlates with global economic momentum and the stockbuilding cycle in particular. The third chart shows a comparison with the contribution of stockbuilding to the annual change in G7 GDP. Stockbuilding cycle lows are highlighted (green squares) along with nearby lows in the cyclical ex tech / defensive sectors ratio (black circles).
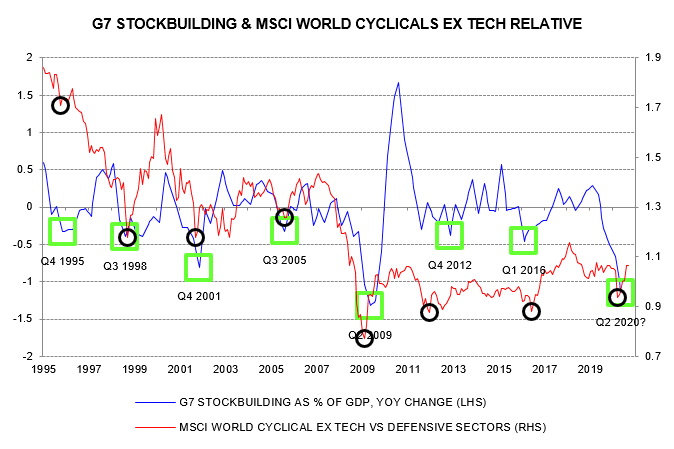
The lows in the ratio corresponding to the last six stockbuilding cycle lows were followed by rallies lasting between 18 and 25 months, i.e. until the next major peak in the ratio. With the current rally starting in March, this suggests no peak before September 2021 at the earliest. The path to the next peak, of course, could involve a significant correction.
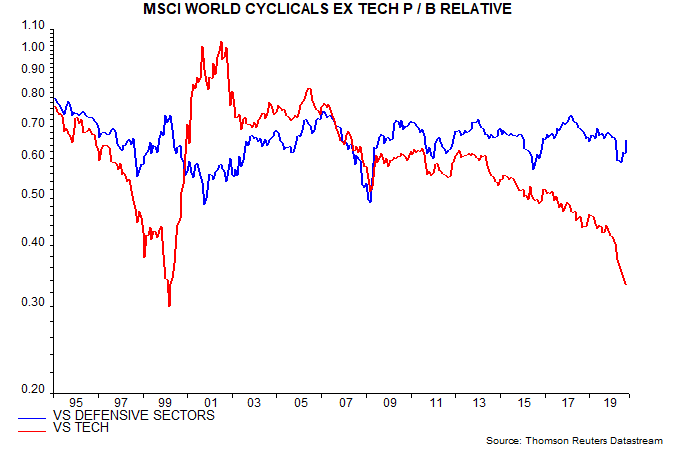
The earliest cycle shown in the chart, i.e. associated with the stockbuilding cycle low in 1995, was the exception – the rally in the ratio reversed after only six months. This anomaly may reflect relative valuation: the ratio of the price to book of cyclical sectors ex tech to that of defensive sectors was unusually high in 1995 – fourth chart.
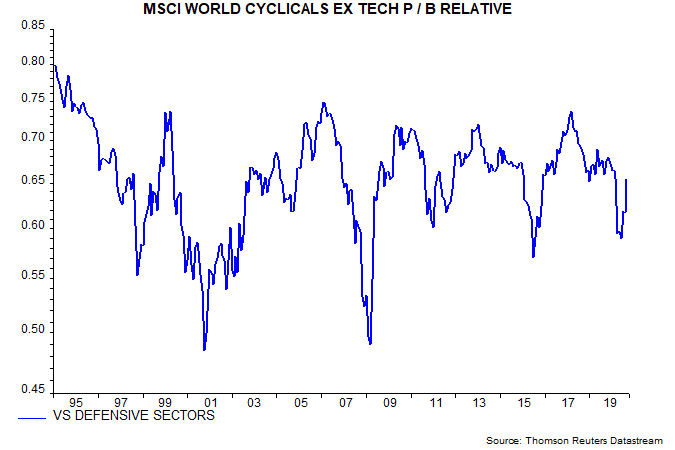
The current valuation ratio is unexceptional at 0.65. The peaks in the last six cycles ranged between 0.69 and 0.75, suggesting a further rerating of 5-14% from the current level.
The final chart also shows the ratio of price to books of cyclical ex tech sectors and tech. Low relative valuation of the other cyclical sectors and their sensitivity to changes in economic momentum could imply outperformance of tech as well as defensive sectors if the global boom scenario suggested by monetary trends plays out.