Subscribe
Sign up for timely perspectives delivered to your inbox.


Head of Global Asset Allocation Ashwin Alankar and Chief Investment Strategist Myron Scholes provide insight on how the options market reacted to the Democratic and Republican conventions and whether the proceedings impacted the market’s assessment of the election’s outcome.
After the conclusion of the Democratic and Republican National Conventions, we asked whether the options market indicated whether these events had materially impacted President Trump’s or Democratic nominee Joe Biden’s election chances. Options-implied insight can provide information different from the consensus found in polling data and herein lies its value.
To assess what the options market is seeing, we measured the options-market pricing of upside and downside risk to so-called US presidential stock baskets. Research firm Strategas has constructed such baskets based on the performance of stocks that have consistently outperformed or underperformed over the last several US elections depending on whether the Democratic or Republican candidate won. The Democratic basket consists of those stocks that have historically performed well under a Democratic win and poorly under a Republican win and vice versa for the Republican basket.
We then plotted the options-implied attractiveness of the Democratic basket relative to the Republican basket. Attractiveness is measured by the ratio of upside volatility – or good risk implied by call options – over downside volatility – or bad risk implied by put options. We call this ratio a tail-Sharpe ratio.
If we assume the stock market is efficiently priced, then the current values of both the Democratic and Republican equities baskets reflect the consensus view on the election and could be considered fairly priced. Thus, any divergence in the option-implied attractiveness of the two baskets – i.e. options markets viewing the Democratic basket more favourably or vice versa – indicates an expectation different from the consensus. Given how options markets are utilised to hedge risk and maximise opportunity, this divergence from underlying equities markets potentially reflects insights not conveyed by the prevailing view.
The chart below illustrates the differences in the options-implied tail-Sharpe ratio or attractiveness of the Democratic versus Republican stock baskets. A positive reading indicates that the options market is assigning a higher tail-Sharpe ratio to the Democratic stock basket and hence expects the basket to outperform the Republican basket. This indicates the options market is assigning greater odds of a Democratic win than what is presently reflected by consensus.
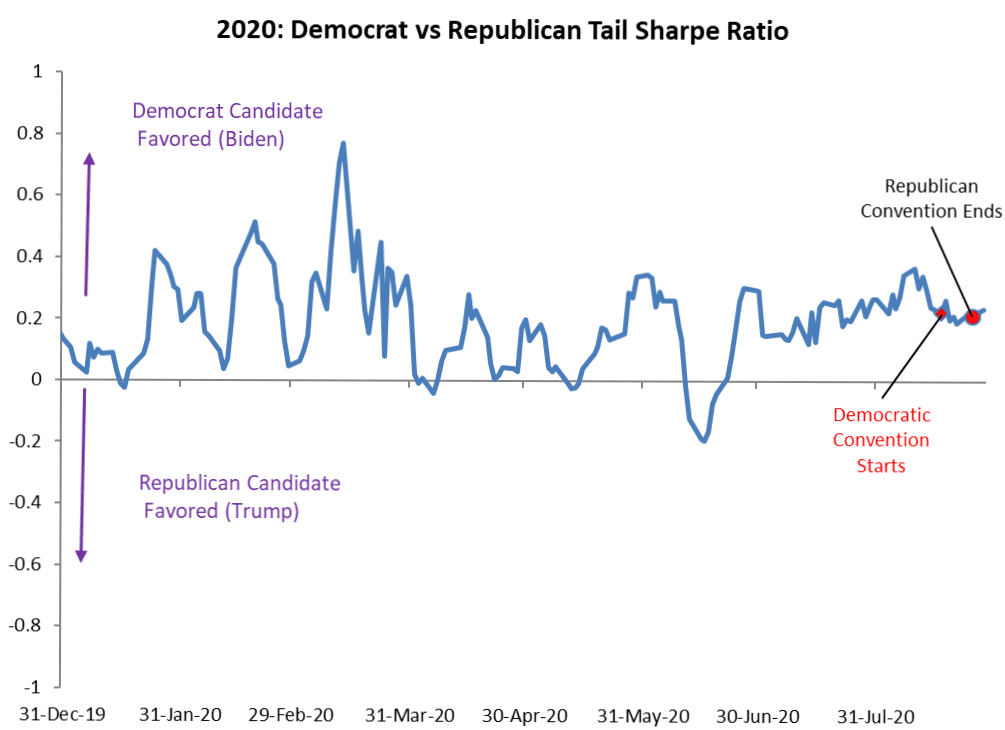
Source: Strategas, Bloomberg, As of 9/28/20
Neither convention did much to materially impact the options market’s sentiment. While the options market continues to show a greater chance of a Biden victory than the consensus, this implied enthusiasm toward the Democratic nominee has fallen from the levels it registered in early August.
During the height of the COVID-19 pandemic in mid-March, the options market’s odds of a Biden win were much higher than the polling data, with the market assigning a much greater attractiveness to the Democratic basket. Since then, the options market’s view relative to the polls has narrowed. As the candidates begin to go on the “campaign trail,” it will be interesting how these views adapt.
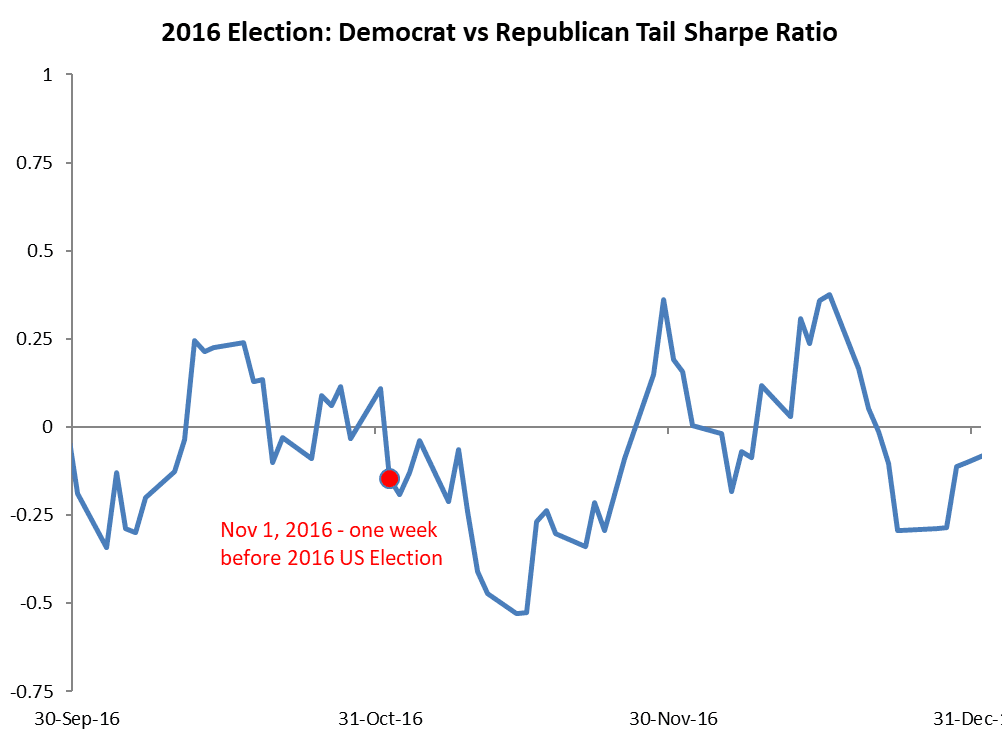
Amid the 2016 election, despite polls and betting markets strongly favouring a win by Democratic nominee Hillary Clinton, the options market – as seen in the second chart below – was more bullish of a Trump win. This indicates the options market provides a differing set of information that can complement other sources, such as traditional polling.
Given we have two months until election day – an eternity in politics – options pricing of these baskets will certainly change. The Janus Henderson Adaptive Global Allocation Team will continue monitoring the options-implied attractiveness of these election baskets.
Source: Strategas, Bloomberg, As of 9/28/20