Subscribe
Sign up for timely perspectives delivered to your inbox.

Daniel Sullivan, Head of Global Natural Resources at Janus Henderson, discusses the factors pointing to a potential multi-year supercycle for commodities and what this means for the opportunity in resources equities.
There are numerous factors affecting the supply and demand dynamics for commodities. While many of these factors can be short-term in nature, such as periods of temporary supply shortages and subsequent oversupply, there are also larger, longer-term price movements known as supercycles, which represent multi-decade periods of price rises and falls.
There have been six commodity peaks in the past 227 years, with the most recent peak in June 2008. Analysis shows that the current supercycle is following the average path of these historic supercycles, pointing to a turn in commodities through the 2020’s.
Chart 1: US commodity price index 1795 to present
Red dots: major inflation peaks, Blue dots: major inflation troughs
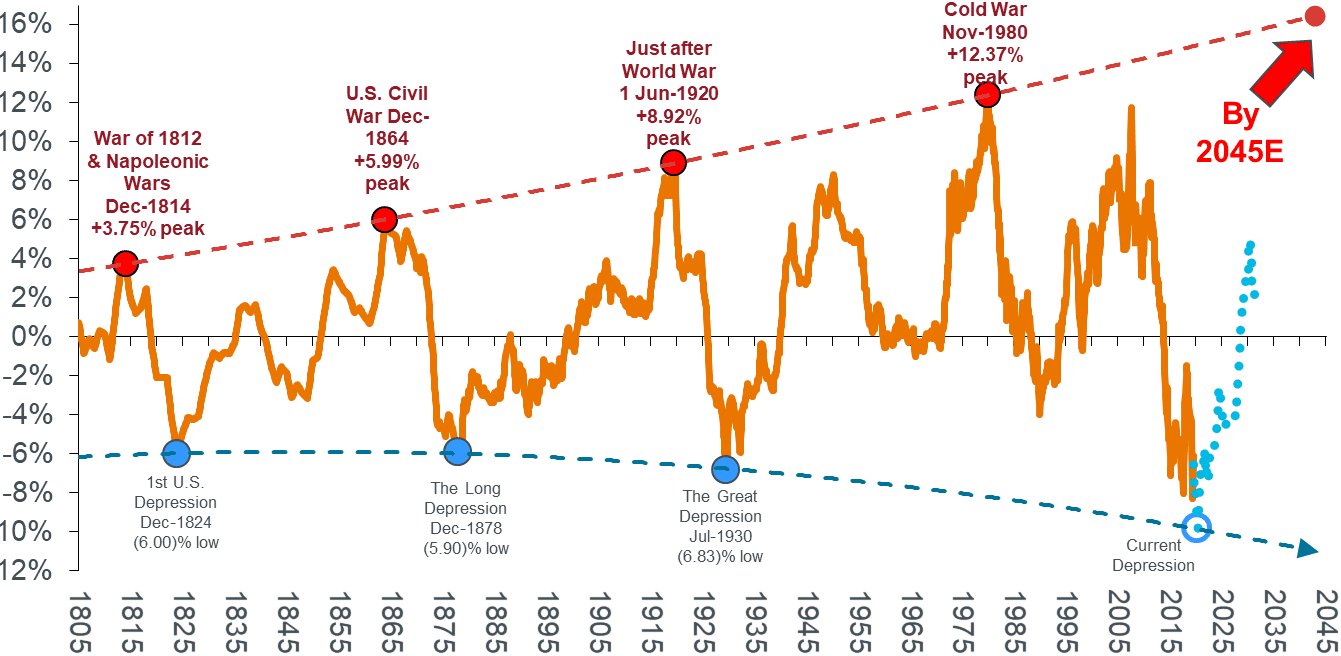
Source: Stifel Report June 2020. Note: Shown as 10yr rolling compound growth rate with polynomial trend at tops and bottoms. Blue dotted line illustrates a forecast estimation. Source: Warren & Pearson Commodity Index (1795-1912), WPI Commodities (1913-1925), equal-weighted (1/3rd ea.) PPI Energy, PPI Farm Products and PPI Metals (Ferrous and Non-Ferrous) ex-precious metals (1926-1956), Refinitiv Equal Weight (CCI) Index (1956-1994), and Refinitiv Core Commodity CRB Index (1994 to present).
What are the factors driving the supercycle?
In China, rising infrastructure spending, rate cuts, more delegation to local governments to support the auto industry and some relaxation of housing policies are positive for metals demand. The copper price, which is often seen as a bellwether for global economic growth, has gained a massive 50% to US$3/lb since the lows in March 2020, while gold has set a new record high of US$2,000/oz (at the time of writing). Silver, rare earths and uranium are also emerging quickly from long slow periods and we believe other commodities are likely to follow.
Valuations are attractive and earnings momentum is positive. Unless we see subsequent widespread lockdowns around the world in response to COVID-19, the strength of the iron ore, copper and gold prices point to double-digit earnings upgrades for the mining sector.
Traditional valuation multiples, such as EV/EBITDA (see glossary), show mining stocks to be cheap relative to the market. In absolute terms, the implied returns embedded in share prices are currently at trough levels.
Chart 2: MSCI World Mining EV/EBITDA relative to the MSCI World
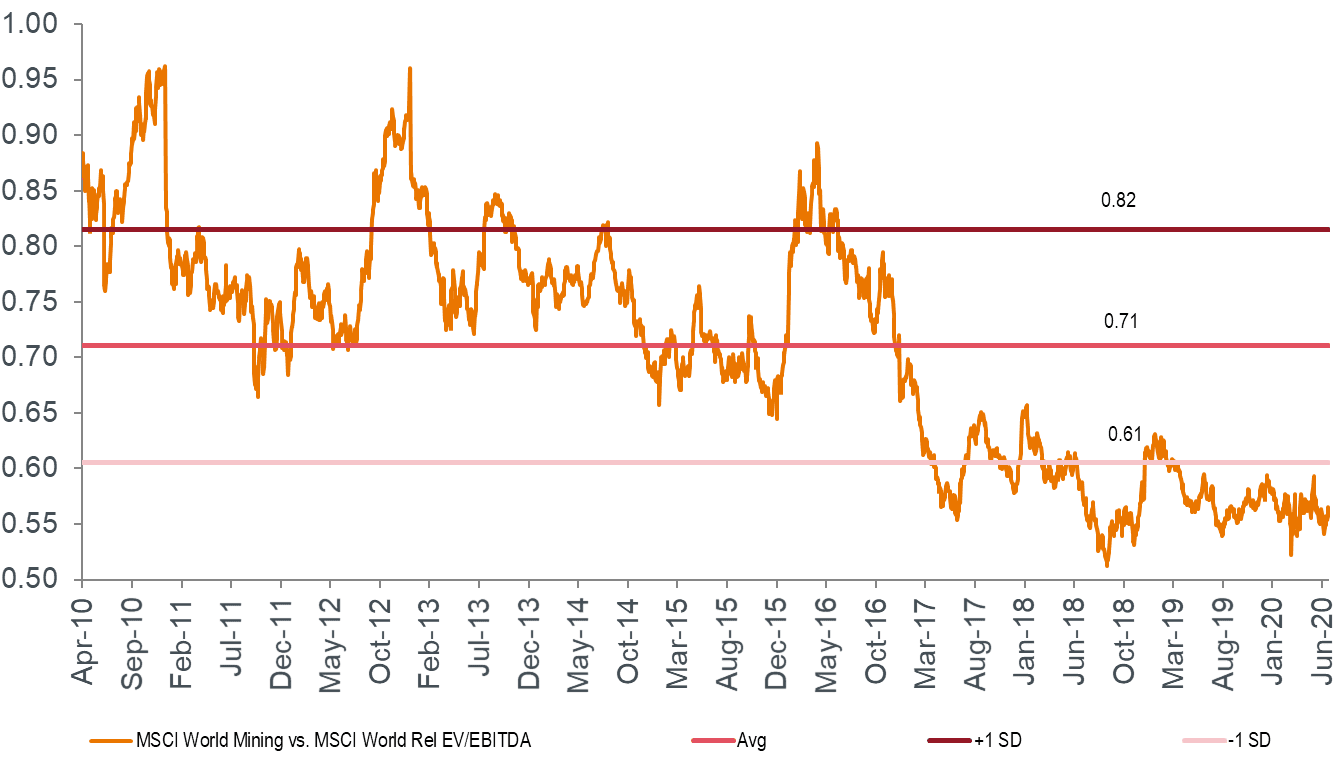
Source: Citi Group Research, FactSet.
Near-term, COVID-19 has delivered a deflationary shock, but inflation expectations may well start to edge higher based on the enormous global stimulus in response to the demand shock. Longer-term, however, the reaction to the virus may well be inflationary.
Rising money supply, expansionary fiscal policy, de-globalisation/re-shoring, a weaker US dollar and waning technology disruption all suggest we should expect higher inflation. In addition, the most politically, socially and economically expedient way to deal with enormous debt is to inflate it away.
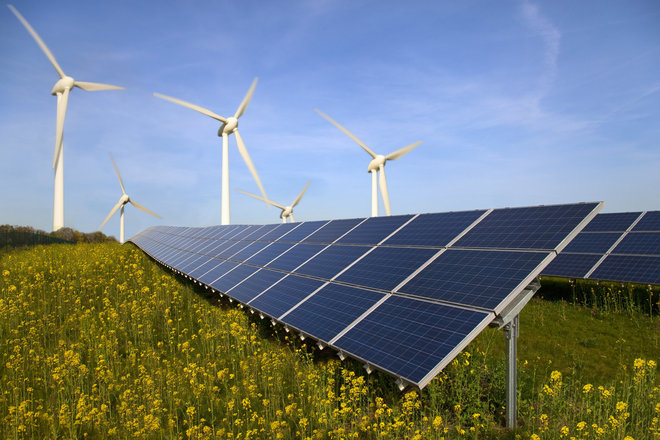
In the mining sector, we don’t think that current valuations reflect the sector’s high correlation with inflation expectations, its real asset characteristics or its exposure to Chinese demand, infrastructure and construction. In addition, rather than being disrupted by it, mining is actually a beneficiary of the ongoing carbon transition given the demand it places on raw materials for components in solar panels, wind turbines, electric vehicles and batteries to name just a few.
 Where are we seeing opportunities?
Our focus remains on quality businesses with significant natural resource advantages. We aim to find companies with ‘outlier projects’ in terms of their grade and size or location advantage across a broad range of commodities and countries.
Underpinning our strategy are the long-term trends of increasing population, prosperity and urbanisation, particularly among developing economies, which is leading to rising global consumption growth rates of natural resources.
In the current environment, as we respond to the short-term market dynamics brought on by the COVID-19 crisis, as well as position for an upswing in the commodities supercycle, our portfolio is well diversified to seek value across a range of opportunities across the three global natural resources subsectors. These include opportunities in gold, copper, diversified mining, US steel and aggregates, industrial gases, wind power equipment and electricity generation, offshore engineering services, oil and gas, uranium, agricultural equipment and products, healthy food, forestry and paper packaging.
Glossary:
*EV/EBITDA: Enterprise Value / Earnings Before Interest, Taxes, Depreciation & Amortisation. This is used as a measure of a company’s market value. While the ratios can vary by industry, a lower ratio can indicate a company could be undervalued, while a higher ratio can indicate a company could be overvalued.