Subscribe
Sign up for timely perspectives delivered to your inbox.

G7 annual broad money growth was little changed at 16.9% in June. Recent growth is the fastest since 1973 – the post-WW2 peak was 18.3% in November 1972. The average in the post-GFC decade (2010-19) was 3.7%.
The monetarist view is that the monetary surge in 2020 will be reflected in a bulge in nominal GDP growth and inflation in 2021-22 as the velocity of circulation normalises following an involuntary plunge caused by government restrictions on economic activity.
The magnitude of the inflation rise and the extent of a subsequent reversal will depend on how far and fast money growth falls back from the current extreme.
On reasonable assumptions about velocity and money growth, G7 inflation could average 4-5% in 2021-22, as explained below.
G7 broad money velocity (i.e. nominal GDP divided by the money stock) trended lower over 1964-2019 but the rate of decline increased between the two halves of this period – see first chart. A simple approach is to model velocity as a split time trend with a break at the mid-point of the period (i.e. end-1991).
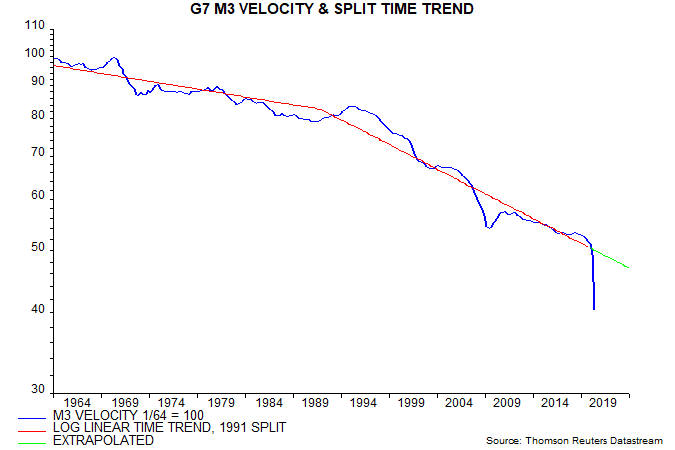
Actual velocity was close to this trend in Q4 2019 but the covid crash in nominal GDP resulted in a 19% undershoot in Q2 2020. The forecast below assumes that 1) velocity returns to trend and 2) the trend rate of decline remains constant (1.75% pa).
Multiplying the money stock by trend velocity generates an implied level of nominal GDP towards which the actual level, on the monetarist view, is likely to gravitate. The historical path of this implied level is shown in the second chart along with a projection based on broad money rising at a constant 4% annualised rate from its July level, i.e. close to the post-GFC average.
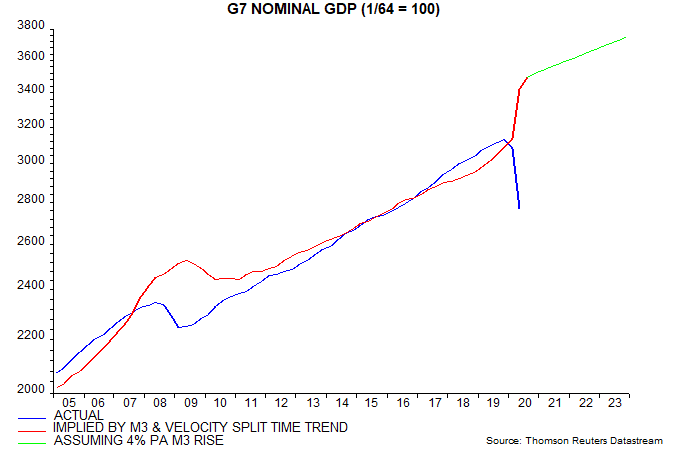
Assume now that actual nominal GDP converges with the implied level in Q4 2022. This would imply a 17% rise in nominal GDP from its pre-covid level in Q4 2019 in the three years to Q4 2022.
Real GDP is expected to return to its pre-covid level by early 2021 and may continue to grow strongly into 2022 but the cumulative rise over Q4 2019-Q4 2022 is unlikely to exceed 6%. A 17% increase in nominal GDP, therefore, could imply a 10-11% rise in prices, as measured by the GDP deflator, in the three years to Q4 2022.
Monetary changes usually take at least year to be reflected in prices so inflation is likely to remain low in H2 2020. The GDP deflator could rise by about 1% between Q4 2019 and Q4 2020. The suggested 10-11% increase in the three years to Q4 2022 would then imply a rise of 9-10% between Q4 2020 and Q4 2022, i.e. an inflation rate of 4-5% pa.
An unsatisfactory feature of the above analysis is the lack of an economic explanation for the falling trend in velocity. The rate of decline, in theory, could speed up, offsetting the inflationary impact of the 2020 monetary surge.The empirical analysis also suggests a role for real government bond yields – the fall in real yields since the 1980s may explain the faster rate of decline of velocity in the second half of the 1964-2019 period noted earlier. (This is consistent with Keynes’s "speculative" motive for holding money: “high” yields cause some investors to expect a fall and consequent capital gain, leading them to switch from money to bonds; conversely, “low” yields generate expectations of capital loss so increase money demand.)
The third chart compares actual G7 broad money velocity with the fitted values of a simple model based on these two factors, i.e. the G7 wealth to income ratio and 10-year real government bond yields. Like the split time trend model discussed earlier, this model suggests an unprecedented divergence between actual velocity and its “equilibrium” level.

Since real bond yields are unlikely to repeat their decline since the 1980s, the model implies a slowdown in the trend fall in velocity unless the wealth to income ratio rises even faster than in recent decades.