Subscribe
Sign up for timely perspectives delivered to your inbox.

Followers of the OECD’s leading indicators take note: the organisation has recently altered the smoothing method used in constructing the indices, increasing the risk of false signals or “whipsaws”.
The OECD’s indicators are used here to confirm signals from monetary trends. The indicators lead the economy at momentum turning points by 4-5 months on average versus 9 months for real money. (The indicators are released later than monetary data and are subject to larger revisions so these numbers understate the real time advantage of relying on monetary analysis for forecasting.)
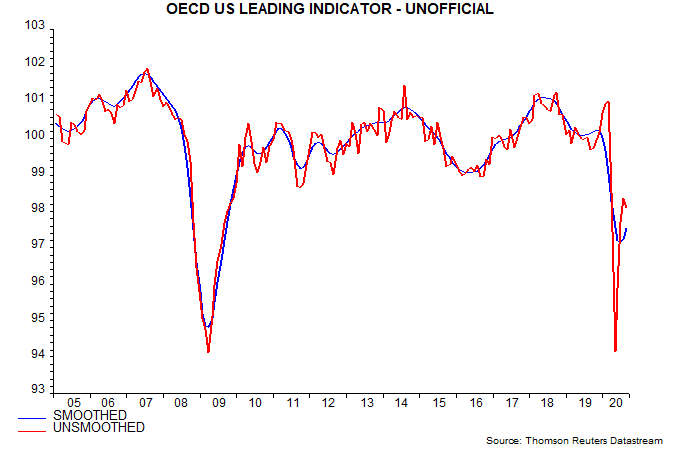
The calculation method for the indicators historically incorporated smoothing of component data to remove short-term noise. This incurred a cost in terms of slightly reducing the lead time at turning points but had the greater benefit of increasing confidence in the validity of signals, i.e. identified turning points were usually followed by sustained directional moves.
This is illustrated by the first chart, showing “unofficial” versions (i.e. calculated here) of the US indicator with and without smoothing. The unsmoothed indicator, although slightly more timely at “true” turning points, gives many more false signals.
What happened this year? The OECD suspended release of its indicators in March because of uncertainty about the data impact of lockdown restrictions. A decision then appears to have been taken, unannounced, to resume publication on the basis of unsmoothed data.
This can be seen by comparing the second chart, showing the “official” US leading indicator series, with the smoothed and unsmoothed indicators in the first chart. The smoothed historical data appears to have been chained to unsmoothed data in 2020.
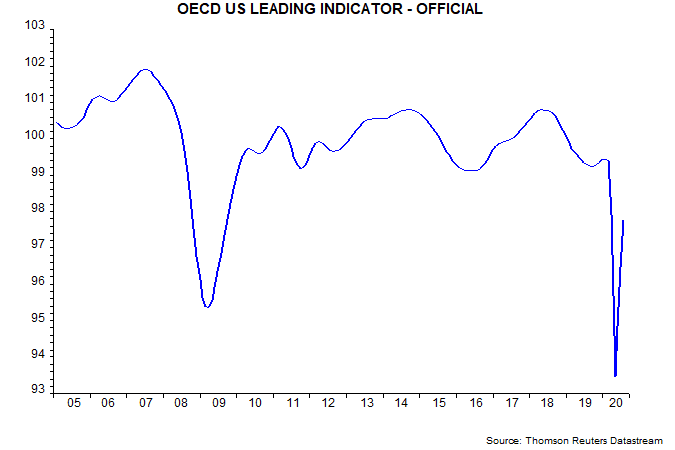
What motivated this change? US / global GDP bottomed in April. The smoothed US indicator bottomed in June. OECD statisticians would have been aware that the smoothed indicators were likely to lag on this occasion so may have decided to emphasise the unsmoothed indicators, which in most countries reached lows coincident with activity in April.
A switch back to smoothed data seems likely at some point but will take some explaining given the recent lack of transparency.
From a practical perspective, the key takeaways are:
1. The June turning point in the smoothed US indicator supports the “monetarist” view that the economy has entered a sustained expansion phase.
2. Any declines in the “official” indicators, assuming that they continue to be based on unsmoothed data, should be ignored unless sustained for several months.