Subscribe
Sign up for timely perspectives delivered to your inbox.

While the first quarter of 2020 will be remembered for its historic “meltdown,” the second quarter will be remembered as an historic “melt-up.” Risk assets of all sorts rallied with a velocity and veracity rarely seen, marking the fastest recovery in history from a bear market. So, where do we head from here? Are we off to higher highs or have we gotten ahead of ourselves?
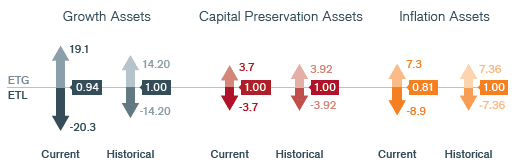
Our Adaptive Multi-Asset Solutions Team arrives at its monthly outlook using options market prices to infer expected tail gains (ETG) and expected tail losses (ETL) for each asset class. The ratio of these two (ETG/ETL) provides signals about the risk-adjusted attractiveness of each asset class. We view this ratio as a “Tail-Based Sharpe Ratio.” These tables summarize the current Tail-Based Sharpe Ratio of three broad asset classes.
Our options-based signals indicate that today’s rally may no longer have much steam behind it. The implied upside to downside ratio – tail-Sharpe ratio – for global equities sits below its average level of 1.0, at 0.93. Furthermore, the downside risk for equities is well above its average level, implying there is a 10% probability that equities fall 20% over the next 60 days. At the same time, implied risk on bonds are also expressing concerns about economic growth as the options market favors bonds over equities. Below-average equity and at-average bond attractiveness cast doubt on the sustainability of the current equity and credit rally.
Risk assets appear to be pricing in a near-perfect recovery in an environment that is fraught with uncertainties. Large risks include permanence in today’s historic unemployment numbers; a disappointing additional round of U.S. fiscal stimulus as the government is much more divided today than in March; a U.S. Democratic election sweep that could see taxes and regulation rise; and we must not forget a resurgence of the coronavirus that could slow economic activity and keep savings rates elevated. Perfect outcomes rarely materialize, and the above risks are not marginal ones, but scenarios that very well could unravel the perfect picture financial markets are reflecting, and with it today’s historic rally. Hence, we leave you with a word of caution and a reminder of the importance of diligently evaluating the risks that markets might be ignoring.
In addition to our outlook on broad asset classes, Janus Henderson’s Adaptive Multi-Asset Solutions Team relies on the options market to provide insights into specific equity, fixed income, currency and commodity markets. The following developments have recently caught our attention:
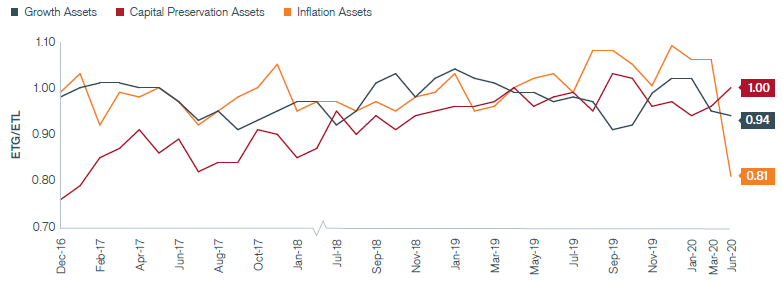
Source: Janus Henderson Investors, as of 6/30/20. Data was not calculated for all months.