Subscribe
Sign up for timely perspectives delivered to your inbox.


Founded in 1930, and with a total asset value approaching £0.5 billion, Henderson Far East Income Limited offers the highest yield within the Janus Henderson investment trust stable – currently over 7%.[1] This, coupled with the fact that dividends are paid quarterly (in February, May, August and November), could make it a viable option for the income-seeking investor. This piece sets out to explore how this yield is being achieved.
[caption id=”attachment_313291″ align=”aligncenter” width=”2752″]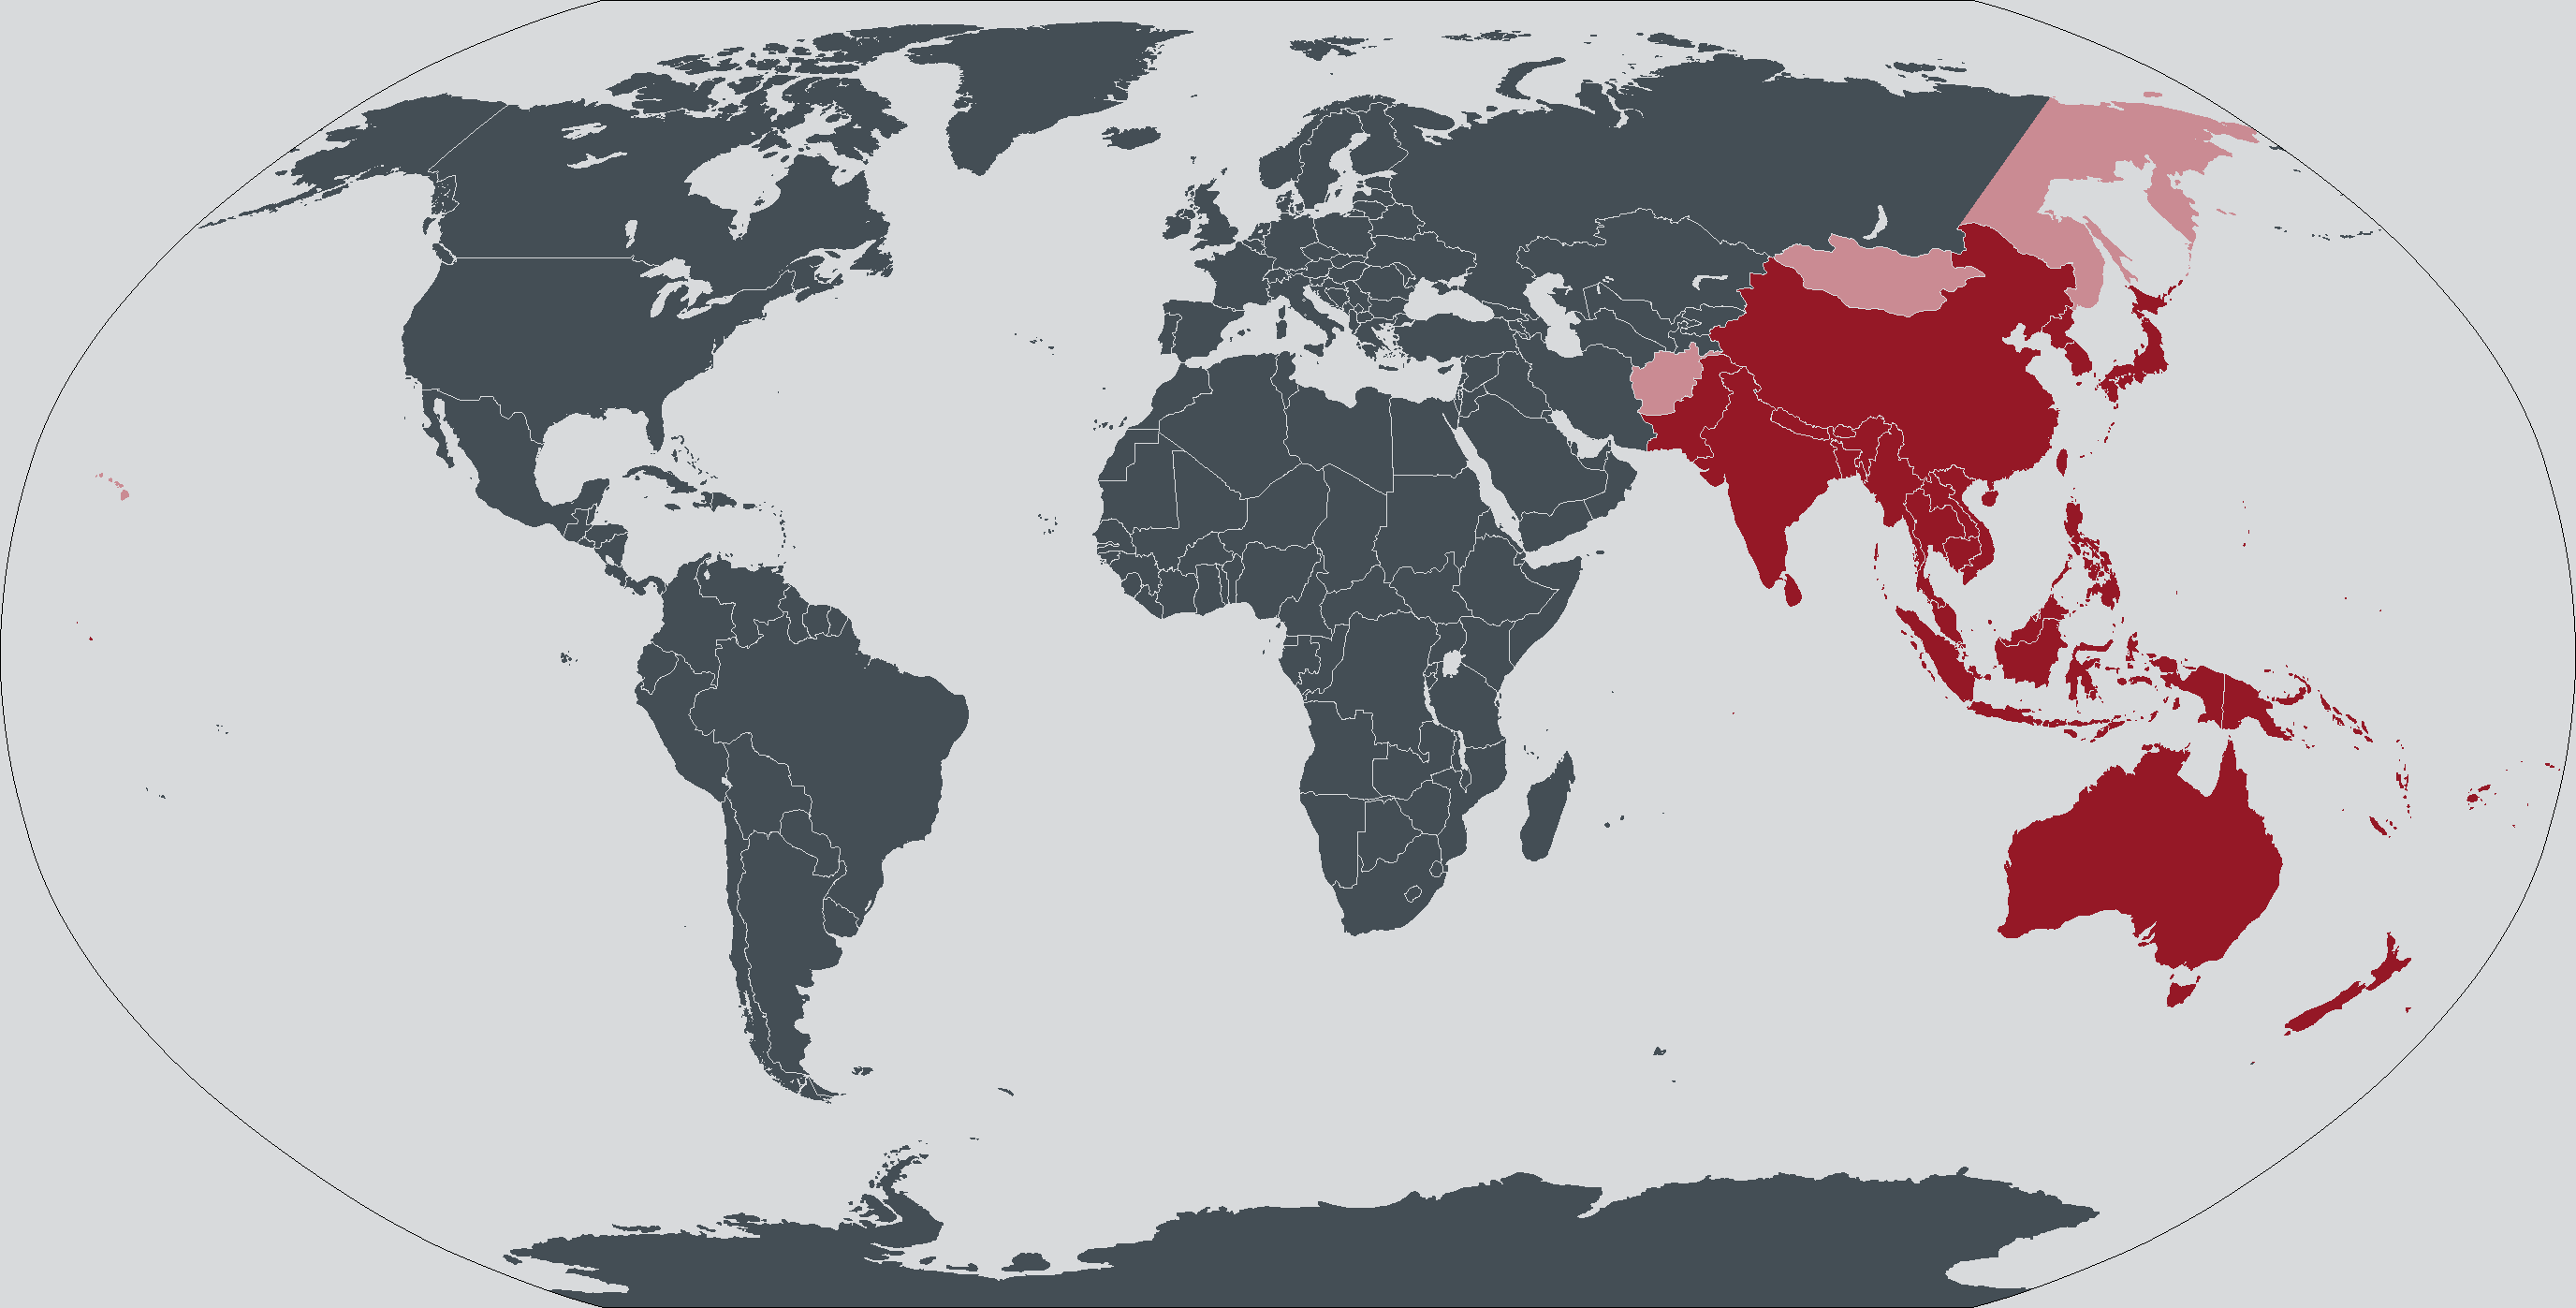 World map highlighting the Asia Pacific region.[/caption]
The trust offers well-diversified access to the growing economies – both developed and emerging – of the Asia Pacific region. It seeks to provide shareholders with a rising dividend per share, as well as capital growth over the medium to long-term, by investing in a balanced portfolio of equities and other securities of companies that are either listed in, registered in, or whose principal business is in, the countries which make up the region. For example, China is currently just over 25% of the portfolio.[1]
[caption id=”attachment_313302″ align=”aligncenter” width=”480″] Mike Kerley and Sat Duhra[/caption]
The managers – Michael Kerley and Sat Duhra – conservatively use derivatives to enhance income and give investment flexibility. The use of derivatives is based around valuation targets and provides an additional source of income allowing the managers room to include lower yielding companies with better potential while avoiding high yield names that are unattractive. The managers may also use gearing (up to 30% of gross assets) without the prior approval of shareholders to make the most of investment opportunities, although the trust is currently not geared.
The trust pursues a value-driven approach, with the emphasis very much on cashflow – ultimately, cashflow pays dividends and, moreover, the managers are firmly of the belief that dividend growth drives capital performance. In terms of asset allocation, China, Australia and Taiwan currently represent 62% of the asset pool by geographical focus, with South Korea, Singapore and Hong Kong making up circa 25%. Similarly, three sectors represent almost 50% of current holdings: Financials, Technology and Telecommunications.3 The top 10 holdings include a number of Asia’s largest and best-known companies, including Samsung Electronics, Rio Tinto and Macquarie.[1]
Regarding the specific aim of delivering an attractively high yield, companies are – needless to say – selected primarily on the basis both that they offer high and sustainable dividends currently, but also have the potential to grow their dividends over time. The Asia Pac region is also attractively valued and continues to offer a wealth of solid opportunities to income investors, partly by virtue of the general growth dynamics of the region but also, and more specifically, as a consequence of the desire to raise the percentage of earnings paid out as dividends in line with their western peers.
Regarding the former, three factors are particularly influential in supporting the view that Asia is a region set for major disruption – the population story, the technology story and the urbanisation story – and we examine these in turn.
In 1950, Chinese life expectancy was 40 years; by 2050, it will have risen to 80 years. As a proportion of the global middle class population, the Asian middle class is set to rise from 28% in 2009 to 53% this year and 66% by 2030 – 3.2 billion of a global total of 4.9 billion.
In 2000, India and China represented 1% and 6% of the world’s internet users; last year, these numbers had grown to 13% and 19% respectively. Only 30% of Asian consumers currently own a smartphone, compared to almost 70% of residents of the USA, but this level of penetration is set to grow dramatically. And China is leading the way in new age technologies – in 2017, Chinese patent applications in the field of artificial intelligence for example, exceeded those of the US by a factor of over six.[2]
In terms of the third phenomenon – urbanisation – it is self-evidently true that cities drive growth; indeed, 85% of global GDP is generated in cities. It is widely predicted that 90% of global urban growth will take place in Asia and Africa; 46% of Fortune 500 companies will be headquartered in the emerging markets by 2025; and seven out of 10 of the world’s largest cities in 2030 will be in Asia.[2]
[caption id=”attachment_313313″ align=”aligncenter” width=”1920″] Source: WikiCommons, Shanghai[/caption]
Turning now to the dividend story, dividends paid by companies in the Asia-Pac (ex Japan) region for the 12-month period to the end of April 2020 grew, on a headline basis, 0.4% to a record £234.8 billion. Asian dividend payouts have more than tripled in the last decade, while the rest of the world has doubled, and four of the largest 25 dividend paying companies in the world come from the Asia Pacific region. In 2019, Asian companies paid £1 in £6 of the world’s dividends, up from £1 in £9 in 2009.[3]
A positive trend in the region is the increased ease with which companies can afford their dividends, stemming from the better discipline they have exerted on spending in recent years. In terms of dividend coverage, Asian companies have nine times more net cash than the current level of dividends paid compared to 3.5 times for US and European companies.[4]
For the year ahead, the pandemic will mean lower dividends but, in Asia, they are likely to fall less than elsewhere. Companies are cash-rich and have room to increase the proportion of profits they pay out to shareholders. Payouts due in the coming months for some of the big markets like China, Taiwan and Hong Kong are based on 2019 profits and mainly seem set to be honoured. Most of the cuts so far announced have been in Australia and New Zealand, following their peers in the UK and Europe. Nevertheless, the region’s dividend payouts are likely to fall at least 17% by the end of April 2021, but our worst-case scenario sees a potential fall of 43%. This is in line with the rest of the world although, if we exclude Australia, New Zealand and HSBC, the picture is significantly more encouraging. Dividends may only fall by 9% in our best-case scenario or 38% in our worst case. In reality, we expect a result somewhere between these two poles, outperforming the wider world.
The total dividend for the trust for the financial year ended August 2019 was 22.4p per ordinary share, a 3.7% increase over the previous year’s total of 21.6p per ordinary share, and well ahead of the equivalent 12-month figure for UK inflation of 1.7%. Furthermore, each year, part of the revenue generated has been held back and not distributed to shareholders for the purpose of smoothing dividends should market conditions become more challenging – as indeed they are now, given the impact of the COVID-19 pandemic on the global economy and, therefore, stock markets. The trust is in a good position to utilise its revenue reserve to bridge any gap therefore and, at present, has a little over six months of dividends in reserve.
Whilst Asia has not been immune to the effects of the pandemic, the Janus Henderson Asia Pacific Dividend Index suggests that the impact has been more modest and the region is expected to recover more quickly. With that in mind, the trust’s Board believes that the impact of Covid-19 does not change the structural growth story for Asian dividends and has reasons to be confident that the positive trajectory will resume once the virus has been contained. Accordingly, it has declared a third interim dividend of 5.8p per share for the financial year ending 31st August 2020, a 1.8% increase over the 5.7p paid for the second interim dividend. 2020 was the twelfth successive year that the trust has increased its dividend.
[caption id=”attachment_313324″ align=”aligncenter” width=”640″]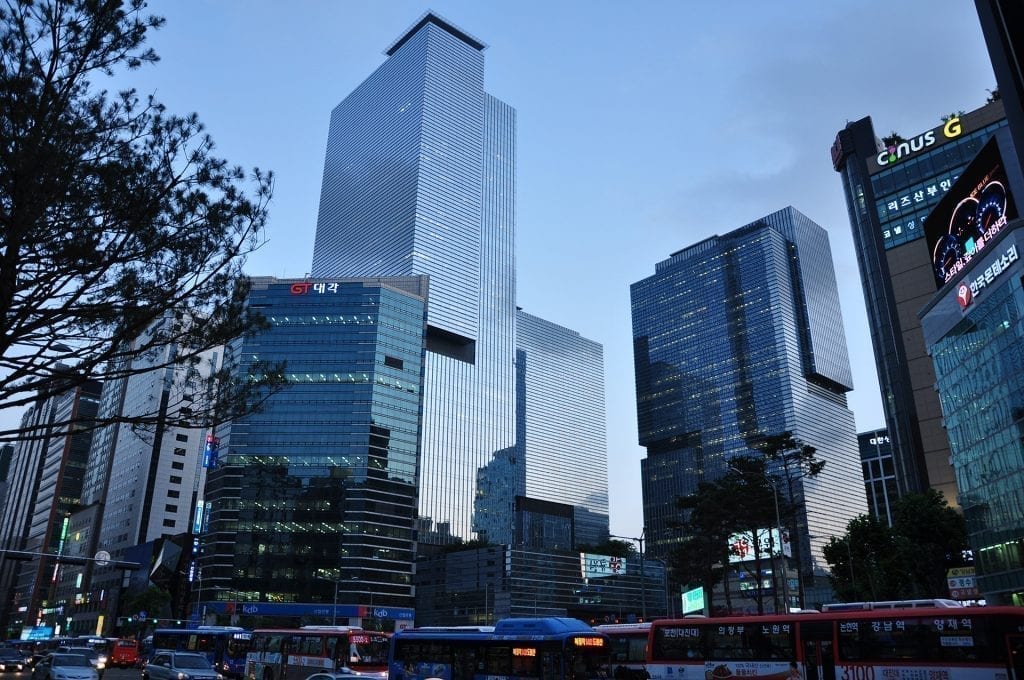 Source: WikiCommons, Samsung Headquarters in Seoul[/caption]
The outlook for dividends in the Asia Pacific region, and thus the prospects for the trust, continue to tell a very compelling story. Asian companies have low levels of debt, a pragmatic view on capital expenditure and strong cash flow generation, and it is our belief that these factors would combine to see dividends continuing to rise in the years ahead. The advent of coronavirus has called into question the sustainability of dividend payments globally and, although some dividends in Asia will be cut or cancelled, we are confident in the ability to pay of the companies we own in the portfolio. Asia Pacific ex Japan has a dividend payout ratio of around 35%[4] far lower than in many western countries, which provides some comfort should earnings come under further pressure.
In summary, therefore, Asia looks better positioned to continue to pay dividends than many other regions. The coronavirus impact has been less damaging than in some western countries and, in China and South Korea, the economic momentum appears to be positive. With the pressure on dividends in other regions, Asia could prove to be the place to look for the income investor struggling to find opportunities.
Glossary
Derivative
A financial instrument for which the price is derived from one or more underlying assets, such as shares, bonds, commodities or currencies. It is a contract between two parties. It does not imply any ownership of the underlying asset(s). Instead, it allows investors to take advantage of price movements in the asset(s). The main types of derivatives are futures and options. Dividend
A payment made by a company to its shareholders. The amount is variable, and is paid as a portion of the company’s profits. Gearing
A measure of a company’s leverage that shows how far its operations are funded by lenders versus shareholders. It is a measure of the debt level of a company. Within investment trusts it refers to how much money the trust borrows for investment purposes Yield
The level of income on a security, typically expressed as a percentage rate. For equities, a common measure is the dividend yield, which divides recent dividend payments for each share by the share price. For a bond, this is calculated as the coupon payment divided by the current bond price.
For a full list of terms, please see our Glossary
Source
[1] Janus Henderson Investors, as at 11th August 2020.
[2] Ipsos, EPFR Global, Citi Research, at at 12th April 2018, Internetworldstats.com, Bloomberg, Frost and Sullivan Analysis, Bank of America Merrill Lynch Global Research, CB Insights, The New Global Economy, seizing the Global Opportunity, World Bank Group: World Development Report 2009. H. Kharas (2010), ‘The Emerging Middle Class in Developing Countries’. United Nations World Urbanisation Prospects.
[3] Janus Henderson Asia Pacific Dividend Index, June 2020.
[4] Jeffries, Factset, Bloomberg. Dividend payouts – banks and region-wide, as at March 2020.