Subscribe
Sign up for timely perspectives delivered to your inbox.

The strong rally in equities since late March contrasts with static longer-term government bond yields, causing some to argue that economic expectations in the two markets are out of sync, the suggestion being that a pessimistic bond market is smarter. This interpretation is not shared here: recovery expectations are modest in both markets, while a key common influence has been a fall in real discount rates driven by global “excess” money.
A static US 10-year Treasury yield conceals a recovery in inflation expectations offset by a fall in the real yield, which is testing its 2012 low – see first chart.
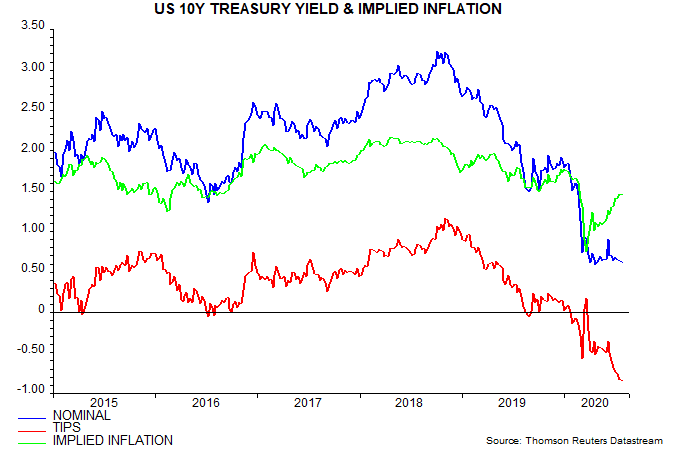
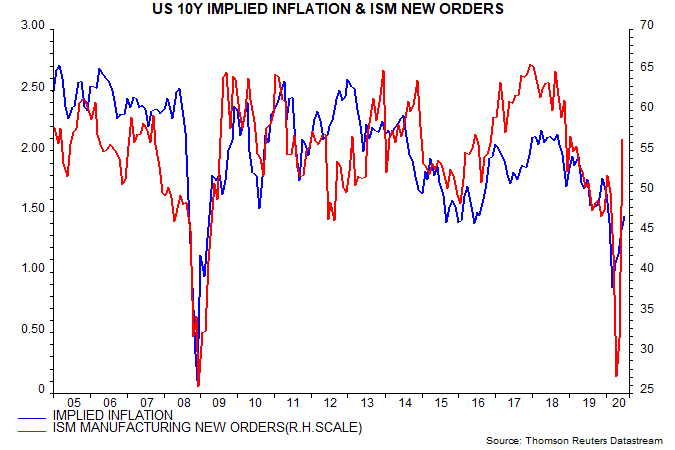
The inflationary component of the yield correlates with forward-looking activity measures, such as the ISM manufacturing new orders index – second chart. Treasuries, therefore, are discounting a modest economic recovery (modest because inflation expectations remain low by the standard of recent years).
Why has the real yield collapsed? The monetarist view is that real discount rates across the investment spectrum have been pushed down by global “excess” money and resulting increased demand for financial and real assets.
The third chart compares six-month changes in the 10-year real Treasury yield and G7 “excess” money growth, the latter measured as the gap between six-month rates of change of real narrow money and industrial output (plotted inverted to reflect the expected negative relationship).
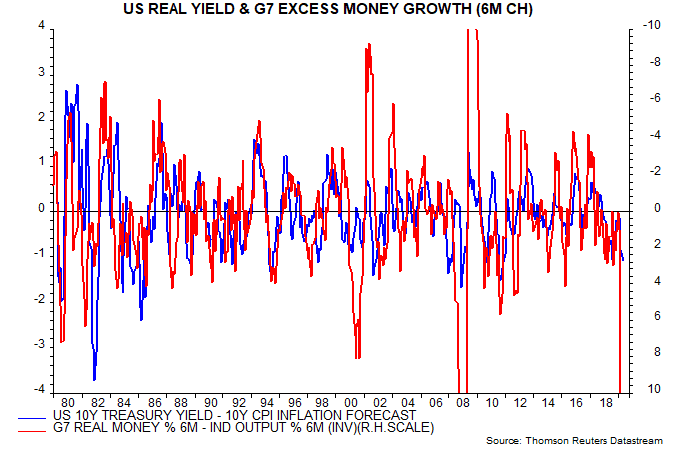
The idea is that falls (rises) in real yields are driven by accelerations (decelerations) in excess money.
Note that the real yield measure used in the chart is the nominal 10-year yield minus the consensus 10-year CPI inflation forecast – this measure has a much longer history than the yield on inflation-protected securities (TIPS).
The chart supports the view that excess money is a key driver of real yields*.
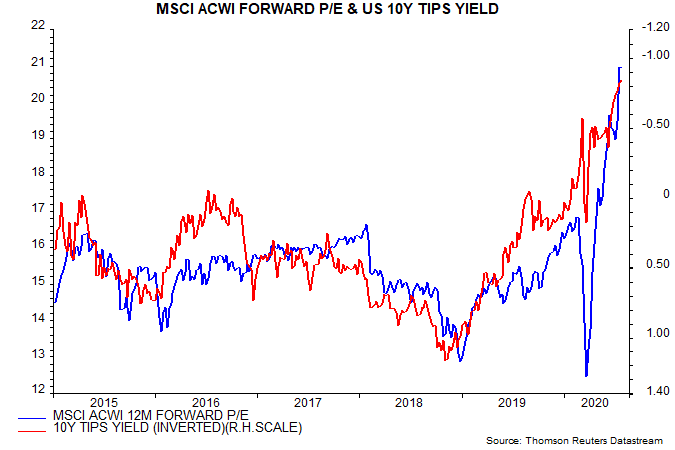
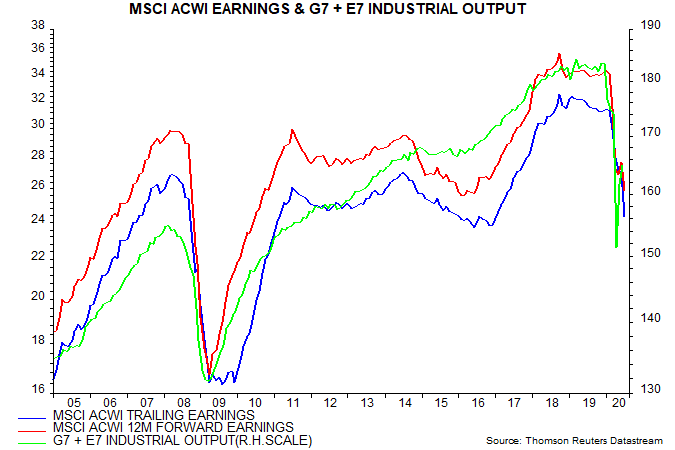
Turning to equities, the strong rally reflects a rerating consistent with the fall in the real Treasury yield – fourth chart.
Analysts’ earnings expectations are gloomy: the 12-month forward estimate has yet to bottom and implies a recovery of only 6.5% from the trailing level, which is down by 22% from end-2019 – fifth chart. So the consensus in equity markets, as with bonds, discounts a limited economic revival. Earnings estimates have substantial upside in the strong rebound scenario favoured here, involving global industrial output returning to its pre-crisis level by H1 2021.
The current favourable excess money backdrop for markets could become much less so during H2.
The sixth chart shows six-month rates of change of G7 real narrow money and industrial output, the latter projected forward assuming constant monthly growth sufficient to return output to 95% of its end-2019 level by December 2020. With real money growth unlikely to be sustained at its current extreme, the real money / output growth gap could turn negative during H2.
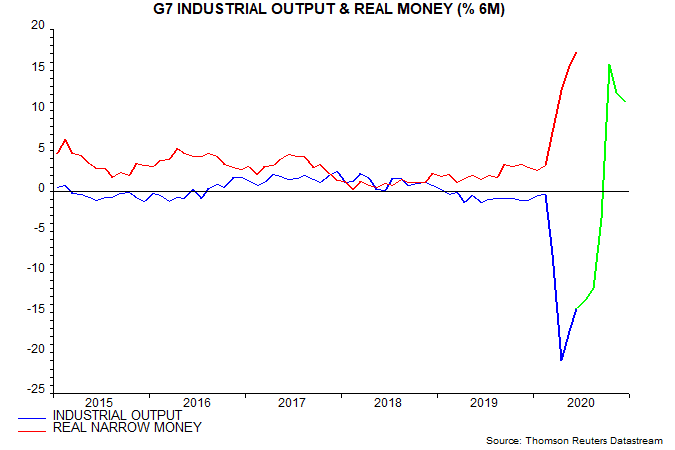
Recall that the direction of real yields is related to accelerations / decelerations of excess money. Excess money is certain to decelerate, whether or not its rate of change turns negative.
The suggestion is that real yields will back up during H2, in turn raising the possibility of a correction in equities unless earnings expectations rise significantly.
A counter-argument is that central banks will cap nominal yields, resulting in a further fall in real yields as inflation expectations continue to recover in line with improving economic prospects. They may want and try to, but can they? Japan’s experience with yield curve control may be misleading – a downward trend in global yields gave the BoJ an easy ride. A vast expansion of QE might be needed to maintain current yield extremes, which might itself prove destabilising by unhinging inflation expectations.
*Statistical measures of the correlation are affected by several instances of extreme movements in excess money growth, including the present. One solution is to impose minimum and maximum levels of -4 and +4 percentage points respectively on the six-month excess money growth change. The correlation coefficient between the six-month real yield change and the adjusted excess money growth change was -0.49 over 1990-2019.