Subscribe
Sign up for timely perspectives delivered to your inbox.
Key takeaways:
The COVID-19 pandemic has obviously brought tremendous upheaval across the globe. The impact also reverberated hard across equity markets. Between 19 February and 23 March, the S&P 500 Index lost a third of its value. Over the same time period, volatility, viewed through the VIX Index, increased from 15 to in excess of 80. The volume that went through on those moves was extraordinary too. As stories of margin calls grew, 12 March saw a record number of trades on the London Stock Exchange (LSE); 2.9 million trades in total, easily surpassing the previous record of 2.7 million trades on 24 June 2016, the day after the UK referendum result.
Many people look back at history for comparisons in these scenarios. My own career really began in earnest during the dotcom bubble. To offer a comparison, in late March 2000, the Nasdaq fell approximately 35% in less than a month before, just as quickly, bouncing 20%. Similarly, 20 years later, the S&P bounced almost 30% in a month off the lows we saw in mid-March this year. In reality; each crisis is unique. The simultaneous supply and demand shock we have seen through this pandemic is arguably unprecedented. Similarly, we have never seen the S&P 500 move more than 9% a day on three consecutive sessions, which it did between 12 March and 16 March.
The main difference we noted through this pandemic was the speed with which markets not only moved but also how quickly the European market microstructure changed. When many people talk about market moves, they often reference volume. While volume is an overall indicator, it is not a useful metric of market quality. We would instead look at bid/offer spreads, touch size and intraday volatility.
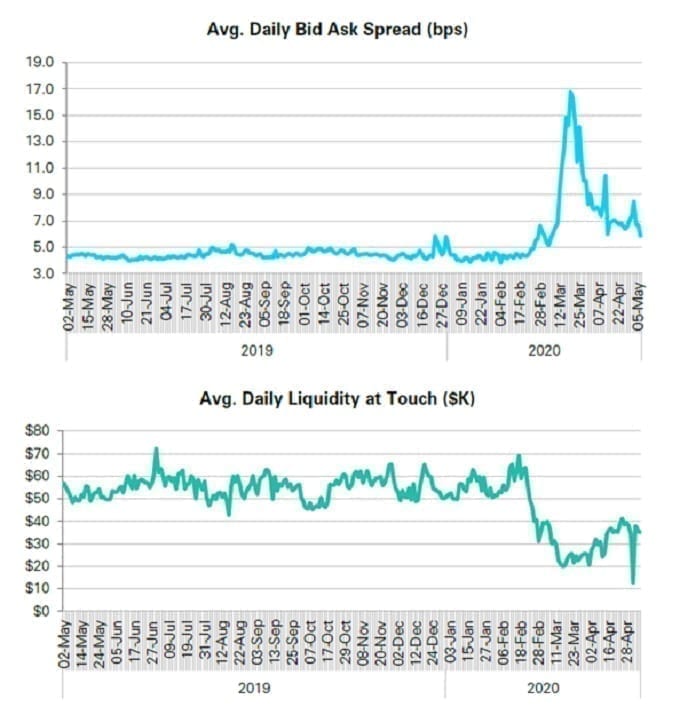
Examples 1 and 2, from Goldman Sachs, show that in Europe spreads more than doubled and liquidity at touch halved. At the same time, intraday volatility was more than 5.5 times normal levels, rising from 1.4% to 7.7%. Those changes happened almost overnight, undoubtedly the ‘benefit’ of the rapid technology changes we have seen in recent years.

Source: Goldman Sachs, 2 May 2019 to 5 May 2020.
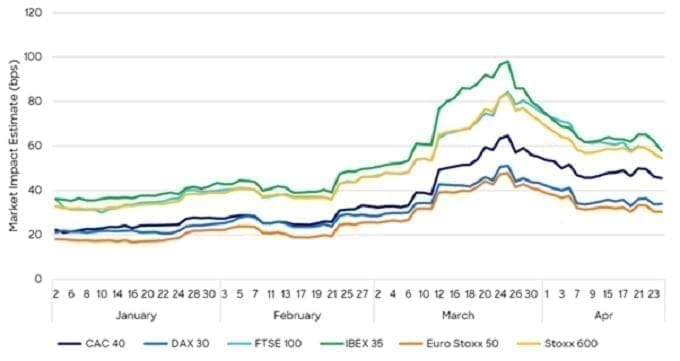
The result was a significant impact on transaction costs. According to data from Liquidnet (Exhibit 3), the cost of a €650,000 order in a FTSE 100 stock more than doubled. A transaction that would have cost 34.6 basis points (bps) in January, rose to 74.5bps in March – a 115% increase.

Source: Liquidnet, 2 January 2020 to 23 April 2020.
The good news is that all crises eventually end. While this one may be far from over, there has been an easing of costs and we see signs that bid/offer spreads, intraday volatility and touch sizes are returning to normal. In terms of how we have traded through it, adhering to ‘Best Execution’ processes and philosophy served us well. For example, our customised algorithmic strategies give us greater control and understanding than if we simply used ‘off the shelf’ broker tools. As a result, we have been able to trade more in low touch channels than ever before.
The role of the buy-side trader is, in some ways, relatively simple. We are there to save money for our clients. I have regularly used the phrase “add the pennies to the pounds”. In basic terms, a portfolio manager sends an order to buy a stock at £1 and your job is to try and buy it at £0.99 rather than £1.01. The more technical term is ‘alpha preservation’. While that sounds easy, a range of factors can make that more difficult.
One factor is latency arbitrage. Latency arbitrage is, simply put, one party exploiting a time disparity; buying or selling a security quicker than another. The Financial Conduct Authority (FCA) recently wrote a paper in which it noted that: “We find that latency-arbitrage races are very frequent (one per minute for FTSE 100 stocks), extremely fast (the modal race lasts 5-10 millionths of a second), and account for a large portion of overall trading volume (about 20%)”. One of the best lines in the paper about arbitrage races was: “You might say it happens in the blink of an eye but you’d be wrong, it’s one thousand times quicker than that”.
One of the ways to navigate the latency arbitrage issue is to utilise minimum fill sizes. For instance, if you set a minimum fill size as a multiple of the average trade size, you reduce the opportunity for a High Frequency Trader (HFT) to pick you off in small trades. Against that though, if you do set a higher minimum, you may miss passive liquidity designed to work over a long duration in small increments. It requires constant evaluation to find the right balance.
The challenge is significant. If the size trading at the best bid or offer has halved and the difference between best bid and offer has doubled, costs will not come down. Despite this, in challenging times, the demands for quick execution increases as investors are often more active in stressed times. For example, JP Morgan noted a 15% increase in client use of aggressive, liquidity-seeking algorithmic strategies and a 25% decrease in use of more passive strategies.
That has not been the case as much for us because we tend to seek liquidity anyway. Asset managers’ execution desks, in contrast, traditionally follow scheduled algorithmic strategies. Indeed, strategies such as VWAP (Volume weighted average price), TWAP (time-weighted average price) or POV (percentage of volume) will typically represent over two-thirds of the flow brokers see electronically.
However, schedule-based strategies have one major flaw. They are reactive rather than proactive. For example, if I’m buying 100,000 shares of a security with a target rate of 10% POV, that trade will only execute after volume has traded. Another example is a VWAP trade, which calculates how you should trade by looking at historic volume and then following that path. Arguably, by following historic volume, you are creating a predictable pattern that would be easy for a HFT to spot. In these situations, you will always be chasing the volume and, particularly in an environment where spreads are wider, market depth is lower and volatility is higher, you do not want to be the one reacting to someone else’s behaviour. In reality though, the best way to navigate change is to adapt. In this case, fast…
Greek philosopher Heraclitus said: “change is the only constant in life”. Certainly, the current ‘working from home’ situation has been a huge change. Half of our London-based equity trading team is in the office, while the other half is working from home. We have set up ‘always on’ calls on a widely used video conferencing application and that has helped maintain dialogue and quick interaction between team members. The key requirement is to have proactive, forward-thinking team players. Overall, it is important to have a philosophy and process but be adaptable, without following a decision tree, because the market is constantly evolving.
Knowledge.Shared is very much the ethos at Janus Henderson Investors. I believe the most important factor to reduce frictional trading costs will always be communication, even in the advent of technological changes. Maintaining an active dialogue with portfolio managers, regarding their trade rationale, allows us to adjust our strategies effectively. In simple terms, while orders may look the same, there is a big difference between the sale of half of a position because the stock has performed well (effectively ‘taking profit’) or selling half a position after the company results and conference call.
In the first scenario, we may work passively, taking advantage of rising prices and ignoring falling prices. In the second scenario, we would be more aggressive early on, trying to sell quickly, possibly even following the price if it traded lower because the results and/or call were deemed disappointing. Ultimately, the key is communication with the portfolio manager – how quickly or slowly they think we need to be, with feedback from us on how the trades are progressing.
While the current day-to-day trading landscape remains challenging, there is potential for even more change and challenge. With the European Commission’s public consultation on the review of MiFID II and MiFIR. Post MiFID II, from a trading perspective, there is a lot to be positive about. There is considerable competition and innovation across the market and that is helping to bring down costs for investors. The Commission is also proposing the establishment of a ‘Consolidated Tape’. Currently, most investors do not have access to all the live prices and data. That is an issue and one that can hopefully be solved by consolidating all the data so all investors can see the same information. This would significantly improve pre-trade transparency, a key requirement of MiFID II, as well as post-trade transparency. We also believe it would help the market to better assess the liquidity of portfolios for risk management.
Our main concerns from the consultation are the possible loss of mid-point as a price option and a potential reduction in trading venues. The European Securities and Markets Authority (ESMA) consultation is, among other elements: “proposing to simplify the DVC regime and to apply it in a wider and stricter way to further curb dark trading”. In some ways, they are right, there is an argument to simplify the market. For instance, if I trade Vodafone today, I could theoretically trade that in over 40 venue types. That intuitively feels excessive. However, competition breeds innovation. That competition and innovation also helps brings down costs, so we are keen to encourage competition.
The proposal to curb ‘dark trading’ would restrict the ability to execute trades at mid-point. When there is a both a buyer and seller in the market at the same time, the middle of the bid-offer spread is the most obvious place to match the two parties and ensures that both sides save money for their clients.
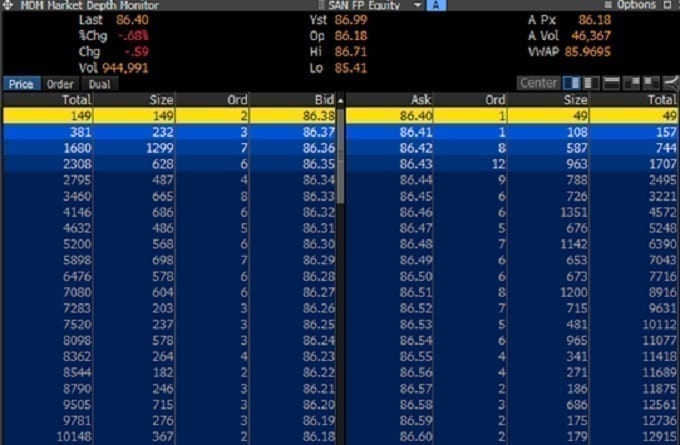
For example, looking at the market depth monitor (Exhibit 4), if one party is buying 10,000 shares in Sanofi (SAN FP) and one is selling 10,000 in the same stock, 86.39 is the obvious price, representing the mid-point between bid and ask. Alternatively, the best offer in the market for the buyer is 49 shares at 86.4 and the best bid for the seller is 86.38 for 149 shares. They would both theoretically trade at worse prices, while failing to complete their orders. That is not in the clients best interests.

Source. Bloomberg. Used for illustrative purposes only to discuss market depth and pricing examples, using Sanofi (SAN FP).
Six of our top 10 venues traded on in Europe so far in 2020 are mid-point venues. They are one part of what helps us be proactive rather than reactive, and they bring costs down. We believe it is vital to maintain them.
Within their response, the Federation of European Securities Exchanges (FESE) stated: “It should also be noted that midpoint is a non-displayed order and therefore plays a role in reducing market transparency. Against this background, mid-point orders are executed at the expense of participants willing to set or display a price.”
The argument around market transparency is, in some ways, correct. We want all market participants to have as much information as possible. However, transparency does not need to just be pre-trade. Let’s take the 10,000 shares of Sanofi example again. If I am a buyer, I know that I could maybe buy 49 shares at 86.4. I can also see the market depth, which shows I can, hopefully, buy my 10,000 shares on the order book up to 86.53. While I cannot see that there is a seller with 10,000 shares willing to trade immediately at 86.39 but if we do trade there it is clearly a better price. While it would not be transparent pre-trade, as soon as we trade the 10,000 shares at 86.39, it is time stamped and the whole marketplace can see that trade. Arguably, that post-trade print of 10,000 helps price formation far more than multiple small trades. You have a clear indication that two sizeable participants think 86.39 is a good price to commit volume to. Post-trade transparency is as important as the pre-trade.
The eagle eyed amongst you will have noted that I said I used the word ‘maybe’ around the purchase of 49 shares at 86.4, or ‘hopefully’ buy 10,000 shares up to 86.53. The issue with the current market structure is that I have no guarantee that I could actually buy those shares. This goes back to the latency arbitrage point I made earlier. Unfortunately, the current exchange order books inherently favour market participants with the fastest technology. Therefore, there is no guarantee you will be successful in buying the shares you try to buy. This arguably contradicts one of MiFID II’s stated intentions, to ‘level the playing field’.
In our view, the regulators should not restrict venues or price improvement. Ultimately existing competition and subsequent innovation has helped to save money for clients. Similarly, the ability to trade at mid-point should be preserved. We understand regulatory efforts to try and improve market structure. The best way to do this is to encourage innovation rather than restrict optionality.
The last few months have presented many challenges. There is no doubt that these challenges will persist. However, by being proactive, thinking ahead and working together, we can all move forward and help reduce costs for our clients.