Subscribe
Sign up for timely perspectives delivered to your inbox.

May monetary numbers have now been released for Euroland, the UK and Canada, allowing calculation of G7 aggregates.
G7 annual broad money growth rose further to 16.9% last month, the fastest since 1973. The post-WW2 peak, reached in November 1972, was 18.3% – see first chart.
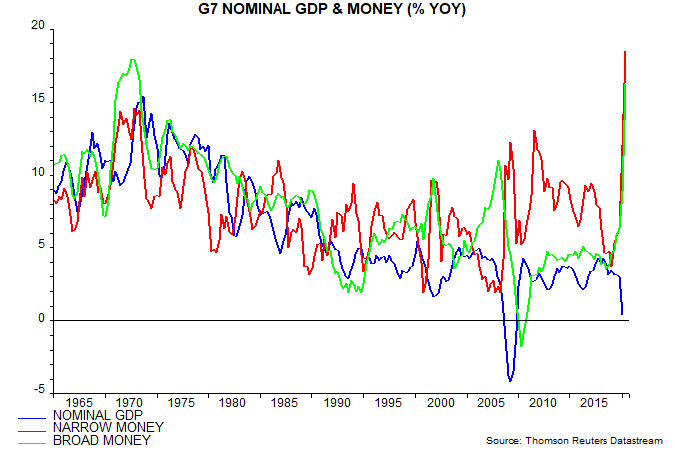
Annual narrow money growth had already surpassed its post-WW2 peak and rose further to 19.5%.
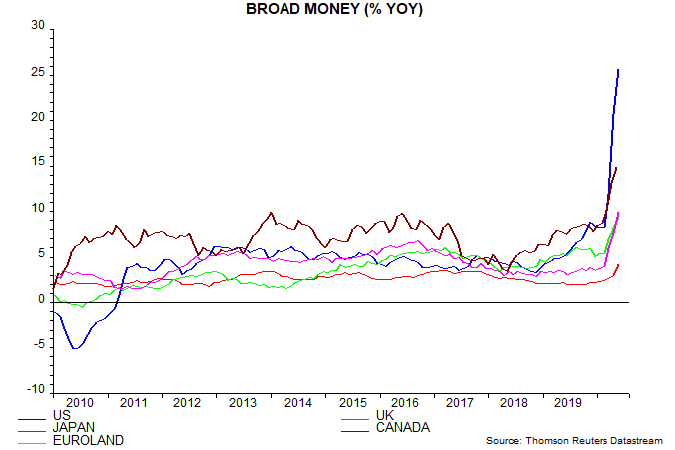
Money growth, broad and narrow, remains much higher in the US than elsewhere – second chart. Canada is in second place with Europe catching up rapidly. Interestingly, the UK has overtaken Euroland, having lagged since end-2016.
What level of future nominal GDP growth might be implied by current broad money expansion?
The monetarist rule of thumb is that monetary changes are reflected in demand and activity six to 12 months later and in prices after about two years. This suggests a peak impact on nominal GDP growth after about six quarters.
Between 1965 and 2018 the difference between G7 annual broad money growth and annual nominal GDP growth six quarters later averaged 1.4 percentage points (pp), i.e. a decline in velocity absorbed 1.4 pp of broad money growth.
Based on this average, current annual broad money growth of 16.9% might be expected to be associated with annual nominal GDP growth of 15-16% by late 2021.
Since current money growth is extreme, it is reasonable to allow for an extreme movement in velocity. The standard deviation of the difference between G7 annual broad money growth and annual nominal GDP growth six quarters later was 2.7 pp over 1965-2018. Assume a prospective difference two standard deviations above the average, i.e. 1.4 + 5.4 = 6.8 pp. Current money growth of 16.9% would then imply nominal GDP growth of about 10% in late 2021.
Assuming that G7 real GDP growth is limited to 3-4%, nominal GDP growth of about 10% would be consistent with inflation of 6-7%.
Note that these numbers relate to late 2021, by which time the positive base effect of the Q1 / Q2 2020 economic shutdowns will have dropped out of the annual GDP comparison, i.e. annual nominal GDP growth is likely to be 10%+ in Q2 2021 irrespective of any monetary boost.
The “quantity theory of wealth” described in previous posts implies an inverse relationship between broad money pass-through to nominal GDP and the wealth to income ratio, i.e. to the extent that the broad money surge is not reflected in faster nominal GDP growth, asset prices and wealth will rise by more over the long run.
The least likely outcome, according to this theory, is inflation weakness coupled with stagnation or deflation of asset prices – a scenario regarded as plausible by many investors.