Subscribe
Sign up for timely perspectives delivered to your inbox.

G7 annual broad money growth is the highest since the 1970s. The consensus argues that this will not be reflected in strong nominal GDP growth and / or rising asset prices because of a faster fall in the velocity of circulation, which has been in trend decline for 50+ years. The purpose of this note is to point out that the trend fall in velocity has been a reflection of a trend rise in the wealth to income ratio. A faster fall in velocity would imply, over the medium term, a stronger path for asset prices and wealth.
The quantity theory of money, in its income version, is based on the accounting identity
MV = PY (1)
where M = the stock of (broad) money, PY = nominal national (or global) income and velocity V is derived as a residual. Nominal income is usually proxied for convenience by GDP. P is a price index of value added in goods and services production and Y represents real income or GDP.
The identity is transformed into a “theory” by assumptions that 1) causation in the equation flows from left to right, 2) velocity is determined exogenously and 3) velocity is significantly less variable than the money stock. Large changes in money are then likely to cause large changes in nominal GDP.
The theory does not require that a given percentage change in the money stock leads to an equal change in nominal GDP. This applies only in the limiting case when velocity is stationary.
Assumption 3) is supported by empirical evidence. The standard deviation of the three-year percentage change in G7 M3 over 1967-2019 was 12.2 percentage points. The standard deviation of the corresponding change in M3 velocity, derived from equation (1), was 4.5 pp.
Velocity, as noted, has been in secular decline or, equivalently, money has grown consistently faster than nominal GDP. Velocity fell at an average rate of 1.2% pa over the 56 years to January 2020. G7 annual M3 growth is estimated to have risen to nearly 13% in April. If such growth were to be sustained, a reasonable expectation would be that nominal GDP expansion would rise to 11-12% pa.
The Cambridge cash-balance approach to the quantity theory interprets equation (1) as a demand function for money. Money is held as a temporary store of purchasing power to bridge purchase / sale transactions and as a component of a wealth portfolio. The Cambridge economists assumed, for simplicity, that both the transactions and portfolio demands for money were related to income. They recognised that the portfolio demand would also depend on wealth but chose to model this effect as an influence on velocity V rather than allowing for it explicitly.
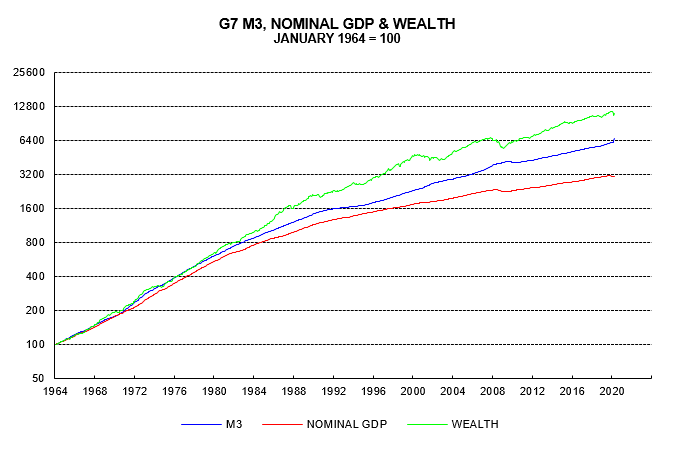
The first chart compares growth since the 1960s in G7 M3, nominal GDP and a wealth proxy encompassing equities, bonds and housing. M3 has outpaced nominal GDP but lagged wealth. Indeed, the ratio of M3 to nominal GDP approximately doubled in the 55 years between 1964 and 2019, while the ratio of M3 to wealth approximately halved. This suggests that income and wealth have been equally important in explaining rising demand for M3.
The “quantity theory of wealth” is a reformulation of equation (1) to incorporate explicitly the wealth effect on money demand:
MV* = (PY)0.5W0.5 = PYw0.5 (2)
where W = wealth and w = W/(PY) = the ratio of wealth to income.
If wealth rises at the same rate as income w is constant and the equation simplifies to (1).
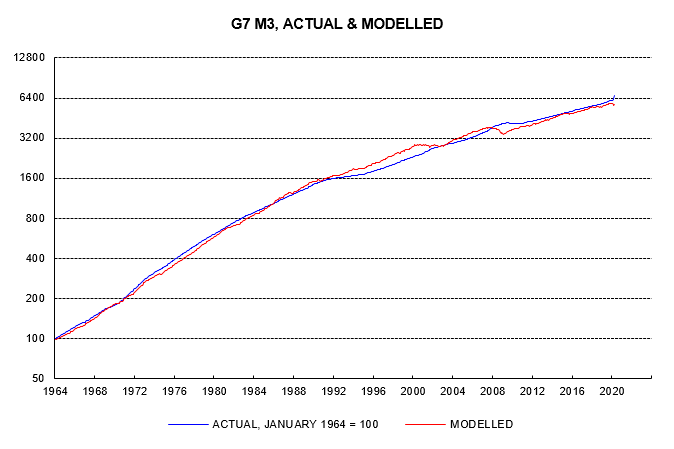
The second chart compares growth of actual M3 and modelled demand based on equation (2), assuming a constant value of V* equal to its full-period average.
Note that V* in equation (2), which could be termed “true” velocity, measures the sensitivity to money stock changes of income and wealth combined, rather than income alone. Dividing (1) by (2) and rearranging
V = V*w-0.5
showing that “conventional” velocity V is inversely related to the wealth to income ratio w.
The third chart compares the two velocity measures. The secular downward trend in conventional velocity V, as explained, reflects the secular rise in the wealth-to-income ratio. By contrast, there has been no trend in “true” velocity V* over the period as a whole. V* did, however, fall significantly during the tech bust (2000-03) and GFC (2006-09). These declines probably reflected cash “hoarding” due to heightened risk aversion, i.e. an additional demand for money unrelated to economic transactions or wealth. V* subsequently recovered in both cases, though not to prior peaks.
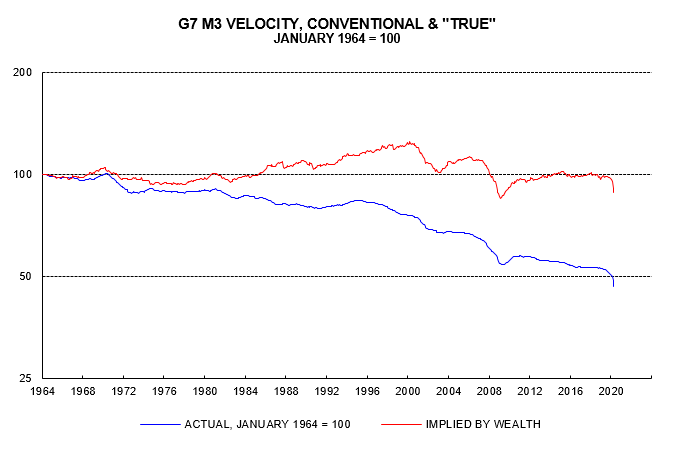
Following its post-GFC recovery, “true” velocity V* stabilised at close to its full-period average over 2013-19. The coronavirus crisis, however, has resulted in another drop, which is likely again to prove temporary.
Equation (2) can be rearranged to solve for the level of wealth W consistent with the current money stock M and nominal income PY:
W = (MV*)2/(PY) (3)
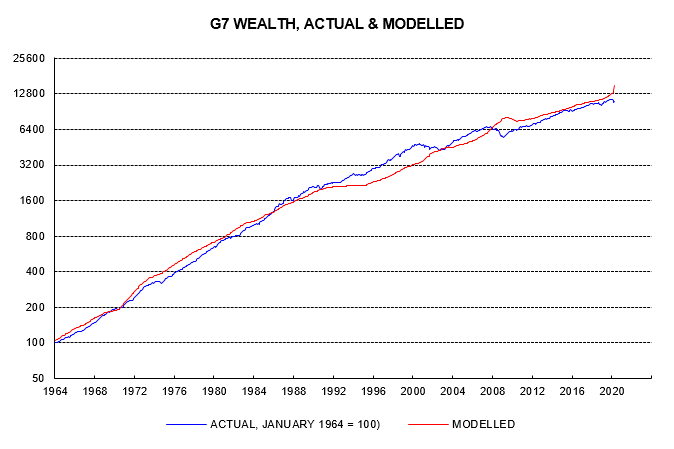
The fourth chart compares growth of actual wealth and the modelled level based on equation (3). Wealth overshot the modelled level significantly during the tech bubble of the late 1990s. The subsequent bust resulted in convergence but no undershoot. By contrast, equity and house price falls over 2007-09 pushed wealth significantly below the modelled level. Wealth has been close to but slightly below the modelled level in recent years but is now undershooting significantly again, reflecting monetary strength and weakness in nominal GDP and equity prices.
The consensus view that monetary acceleration will not feed through to stronger nominal GDP growth and / or asset prices assumes an offsetting large-scale increase in cash hoarding. The evidence presented above suggests that episodes of significant cash hoarding are infrequent and temporary. The long-term decline in conventional velocity mainly reflects a rising wealth to income ratio. If the consensus forecast of no rise in nominal GDP growth proves correct, the implication is a stronger, not weaker, medium-term path for asset prices and wealth.