Knowledge. Shared Blog
April 2020
What Just Happened in the Oil Market?
-
 Mathew Kaleel
Portfolio Manager, Diversified Alternatives
Mathew Kaleel, Portfolio Manager, Diversified Alternatives, outlines the confluence of events that caused a major global oil benchmark to trade below zero for the first time in history.
Key Takeaways
- Multiple factors led to the historic move in oil markets this week, including a lack of storage, lack of liquidity and significant volume on one side of a physically deliverable market.
- Oil prices collapsed until buyers who could take physical delivery of the crude were finally incentivized to step into the market.
- While this event was quite idiosyncratic, it reflects the broader dislocation in markets and the extent of the demand destruction that is occurring as a result of COVID-19 lockdowns in most countries.
April 20 marked another historic market move that has never been seen in our lifetimes: a major global oil benchmark trading negatively.
While less well-known oil benchmark prices have traded below zero, the fact that the May 2020 West Texas Intermediate (WTI) Crude Oil Futures Contract settled at -$37.63 per barrel at the trading day’s close marks another unique market dislocation in the current environment.
What actually happened?
The front month WTI Crude Oil contract (May 2020 WTI Crude) was nearing the last days of trading prior to going into the delivery phase. The day saw a complete collapse in prices, with no bids at certain times of the day. For context, the previous day’s close was $18.27 per barrel, for a one-day fall of $55.90. The chart below shows a one-month time series for this contract.
May 2020 WTI Crude Oil
Price per barrel (USD), 30-minute price series over one month
[caption id=”attachment_287079″ align=”alignnone” width=”711″]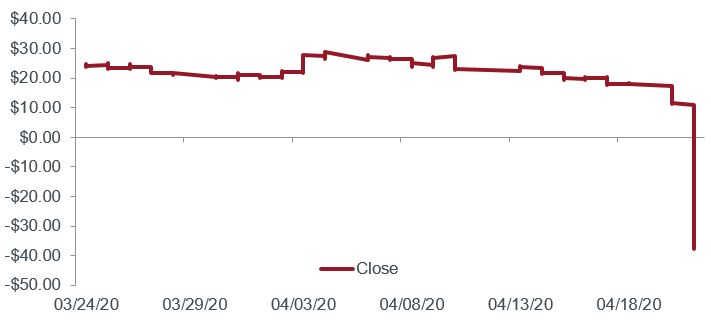 Source: Bloomberg, as of 4/21/20.[/caption]
Why did this happen?
In the simplest terms, the price collapse was a function of multiple events occurring at the same time:
- A significant oversupply of oil due to a collapse in U.S. energy demand as a result of lockdowns throughout the country.
- WTI is based inland, with the main delivery point being in Cushing, Oklahoma. This oil benchmark relies on there being sufficient spare capacity at Cushing, Oklahoma, to take delivery.
- Cushing’s capacity has been falling recently because of oversupply.
- The May 2020 oil contract was approaching expiration, so liquidity was drying up; most commodity traders and major indices had already rolled contracts into June 2020 and beyond.
- WTI futures contracts are physically deliverable, i.e., if you are holding a long position on expiration, you will be delivered 1,000 barrels of WTI Crude per contract held. As such, if you are unable to store this oil, you should not be holding this contract this close to expiration.
- Oil exchange-traded funds (ETFs) held a substantial long position in this contract going into expiration and were trying to sell May futures and buy June futures on Monday.
- With a lack of storage, lack of liquidity and significant volume on one side of a physically deliverable market, prices collapsed until buyers who could physically take delivery and store crude were incentivized to step into the market.
Are oil prices generally trading at these levels?
No. This situation is a short-term idiosyncratic dislocation in one particular oil market in which a lack of available storage converged with a financial buyer of oil (mainly the oil ETFs). The chart below compares the prices over the last year for both May 2020 and June 2020 WTI Crude Oil futures contracts.
Until recently, the spread (difference) between these two contracts was immaterial. In the beginning of March, the imposition of lockdowns throughout the U.S. led prices to gradually diverge as traders priced in a short-term supply shock and then a much more significant collapse in demand as lockdowns were imposed globally. Additionally, as storage has filled up in Cushing, the May contract repriced to incentivize buyers that are able to take physical delivery and store this oil.
May 2020 and June 2020 WTI Crude Oil Futures Contracts (USD)
[caption id=”attachment_287090″ align=”alignnone” width=”722″]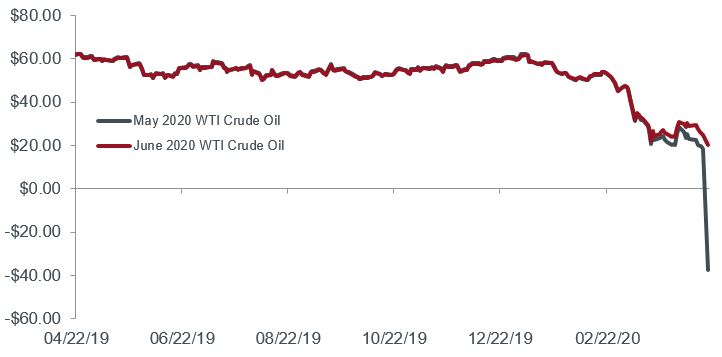 Source: Bloomberg, as at 21 April 2020.[/caption]
The issue with the markets on Monday was a confluence of long financial positioning in a physically deliverable market without any ability to store that oil. The uniqueness of this particular contract trading negatively is shown below in the term structure of WTI Crude on April 20. Apart from the front month (May 2020), WTI Crude over the next three years has an expected price range of at least $20 at the time of this writing.
WTI Crude Oil Term Structure as of April 20 (USD)
[caption id=”attachment_287101″ align=”alignnone” width=”715″]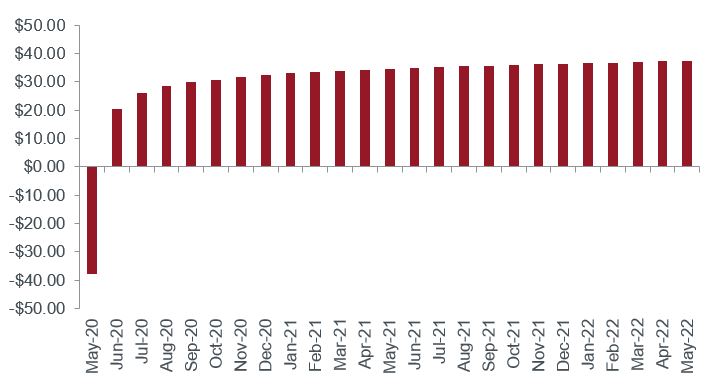 Source: Bloomberg, as of 4/21/20.[/caption]
What broader meaning can be attached to this event?
While this event was quite idiosyncratic in terms of a large financial buyer holding a physically deliverable contract far too close to expiration, it reflects the broader dislocation in markets and, more importantly, the extent of the demand destruction that is occurring as a result of lockdowns in most countries. Where this has particular relevance in terms of add-on effects are in the following areas:
- U.S. onshore oil producers: In general, smaller higher-cost producers will likely shut in (close) wells. This is a function of each well’s cash and variable costs. The longer prices remain around current levels (around US$20/barrel), the more supply will be taken out of the market; it is not economically viable to produce oil that potentially requires paying a buyer money to take it.
- Producers whose wells are further inland are at larger risk as they deliver to a point, such as Cushing, which, as mentioned above, has limited capacity.
- Significant fall in rig activity, capital expenditures and new activity. The chart below shows the clear relationship between oil prices and rig activity.
Spot WTI Crude Prices (USD) vs. Active Onshore Rigs over the Last 10 Years
[caption id=”attachment_287112″ align=”alignnone” width=”757″]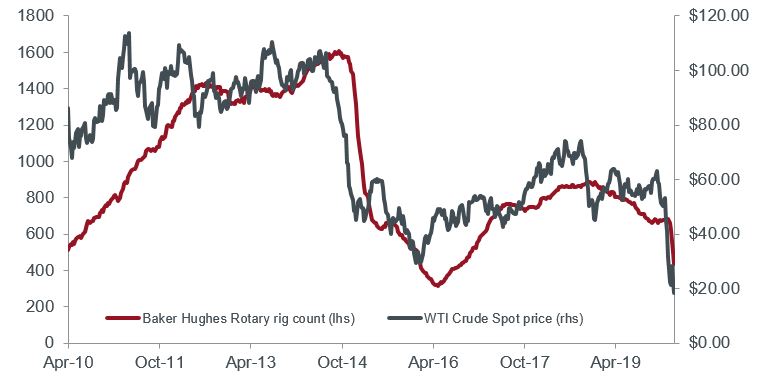 Source: Bloomberg, as of 4/21/20.[/caption]
Rig activity is a purely economic response to oil prices. As oil prices have traded lower and are now at a level that renders few, if any, onshore oil wells profitable on an all-in cost basis, rigs in use have collapsed. Commodity markets are effective as a clearing mechanism, and prices will remain at a point that will assist in rebalancing markets.
The most likely path of rebalancing, based on unprecedented demand destruction and muted demand going forward, is a significant curtailment in supply either via voluntary production cuts or shut-ins. This also implies a potentially high probability for a large number of energy companies – likely those that are focused at the smaller, higher cost point of the industry – to cease operations completely.
What should we watch out for to see if it can happen again?
There are a number of signs to watch out for in markets over the next few weeks:
- Changes in Cushing inventory levels: There should be time for oil at Cushing to be diverted to other storage facilities.
- Changes in rig counts and commentary from oil companies in the U.S.: This will have the most meaningful impact in rebalancing the market. Significant supply cuts on the order of 2-3 million barrels per day are needed to offset some of the demand destruction.
- Refinery runs: These can be throttled to take some crude capacity.
- Changes in oil ETF holdings: Hopefully, holdings will fall, and ETFs will roll contracts earlier.
Abandon Your Doubts,
Not Your Goals
Learn MoreNote: All prices in US dollars (USD) unless specified otherwise.
Knowledge. Shared
Blog
Back to all Blog Posts
Subscribe for relevant insights delivered straight to your inbox
I want to subscribe