Subscribe
Sign up for timely perspectives delivered to your inbox.

This past quarter will be remembered as one of the most volatile and unique quarters in financial market history. A global pandemic threatening global health raged throughout the world, sending markets into free fall. Governments responded with uncharacteristic swiftness to do “whatever it takes” to counter the economic pain caused by the fight against the COVID-19 coronavirus. And just as quickly as markets fell, they began to rise – a potential harbinger of a “V shaped” recovery?
The key question is will the V succeed or could we see a second leg down in risky assets. Our options-based signals are indicating that a V shape recovery may not be in store. The implied upside to downside ratio tail-based Sharpe ratio (tail-Sharpe) for equities – at 0.95 – sits below its average level of 1.0, and the downside risk for equities is well above its average level. Both indicate a greater potential for loss going forward than gains.
Not a good sign. It is true that these indicators have been trending in a positive direction since the nadir of market upheaval, with significant improvement in both the equity tail-Sharpe ratio and downside equity risk. But the improvements have not yet brought us into a territory to warrant a shift toward aggressively overweighting risk.
(Article continued below)
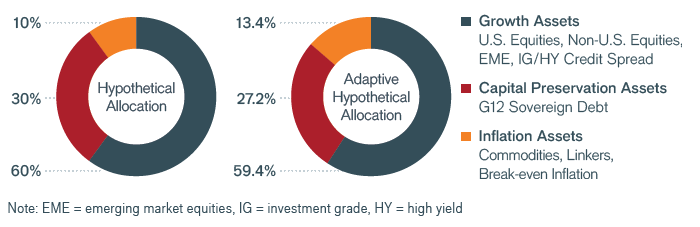
Using proprietary technology, Janus Henderson’s Adaptive Multi-Asset Solutions Team derives tail risk signals from options market prices on three broad asset classes. Given our current estimates of tail risks, we illustrate how those signals would impact a 60/30/10 allocation.
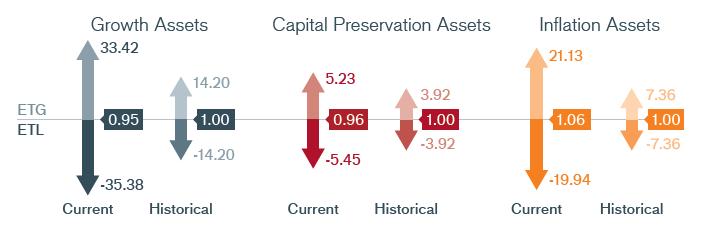
The “Tail-Based Sharpe Ratios” have been normalized to 1.00 to allow for easier comparison across the three macroeconomic asset categories.
*We define ETG and ETL as the 1-in-10 expected best and worst two-month return for an asset class.
Our Adaptive Multi-Asset Solutions Team arrives at its monthly outlook using options market prices to infer expected tail gains (ETG) and expected tail losses (ETL) for each asset class. The ratio of these two (ETG/ETL) provides signals about the risk-adjusted attractiveness of each asset class. We view this ratio as a “Tail-Based Sharpe Ratio.” These tables summarize the current Tail-Based Sharpe Ratio of three broad asset classes.
Earnings season is around the corner and we expect to get additional context on the impact that virus containment efforts have had on economic activity. But it is likely to be a very rough and cloudy view as very few companies – if any – will provide forward guidance given the unique nature of the episode. Analysts’ revisions currently are quite shallow, with 2020 earnings estimates revised downward by just 10%, which, if true, indicates that the crisis truly is transient and equity prices, being long-duration assets, should be affected only marginally. But earnings revisions for the Russell 2000® Index currently have been revised at a pace much faster than during 2008. Small-cap public and private business represent over 50% of the employment in the U.S., so pain felt here will certainly have broader cascade effects.
However, we believe that implied downside risk and uncertainty is still quite high because we could see a permanent destruction of demand. Temporary unemployment has soared and there is a real danger that a significant portion of this becomes permanent and the days of 3.5% unemployment are behind us. This would lead to a drop in consumption, a rise in defaults and bankruptcies, with all constraining growth and stressing the financial system. At the same time, we likely will not see a robust recovery or quick return to normal until a COVID-19 vaccine is developed. Furthermore, the “bridge” the government has built while lockdowns are in place may be a bridge to a very different world; a world where demand for services falls as populations are reticent to venture out in public. Government largesse cannot extinguish these cascading affects and this may well become a significant headwind to risky assets going forward, which could result in a retesting of recent market lows. So the bear may put an end to the recent rally and this may be just another bear market rally that one does not want to get sucked into.
One possible consequence of the rapid buildup in public debt and liquidity is inflation. And the options market is worried about this with the tail-Sharpe ratio of inflation assets higher than other assets. While today’s crisis is different from anything we have encountered, the price action has an eerie resemblance to October 1931. That period’s interim rally quickly ran out of steam and gravity brought the market back to lower lows. At this point, we leave you with the word caution.
In addition to our outlook on broad asset classes, Janus Henderson’s Adaptive Multi-Asset Solutions Team relies on the options market to provide insights into specific equity, fixed income, currency and commodity markets. The following developments have recently caught our attention:
(ETG/ETL)
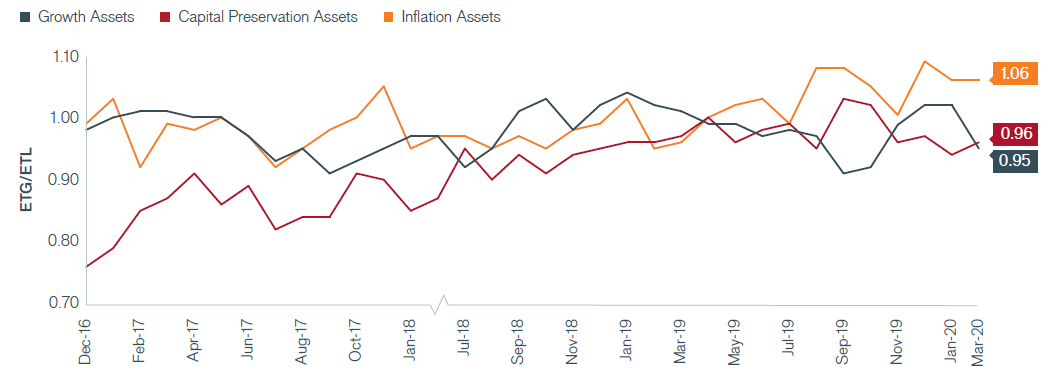
Source: Janus Henderson Investors, as of 3/31/20. Data was not calculated for all months.