Subscribe
Sign up for timely perspectives delivered to your inbox.


The managers of the Janus Henderson Horizon Euro Corporate Bond Fund reflect on the current COVID-19 crisis and whether there are any parallels with the Global Financial Crisis and its aftermath for the European investment grade corporate bond market.
Back in 2009, Janus Henderson launched the Horizon Euro Corporate Bond Fund, a fund focused on investing primarily in European investment grade corporate bonds.
We were confident in the strength of our corporate credit team so there were no concerns about our ability to manage the fund but some investors queried the timing. Unnerved by the volatility that had hit bond markets during the Global Financial Crisis (GFC), some felt it was too soon to be launching a new corporate bond fund. Others felt we had left it too late and missed the summer rally that had seen bond prices rise as credit spreads retreated from their peak in March 2009. In the end, we proved the naysayers wrong, with the fund going on to outperform the market (see Figure 1).
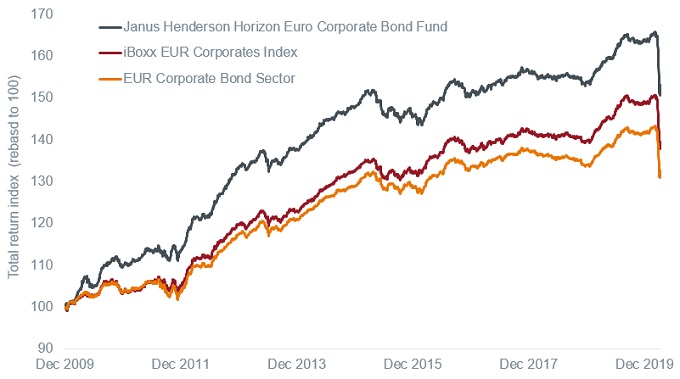
Source: Morningstar, All rights reserved, performance is on a net of fees basis with gross income reinvested, in euro. Fund: Janus Henderson Horizon Euro Corporate Bond Fund A2 EUR share class. This is the representative share class. Performance may differ from above depending on the share class. Index: Markit iBoxx Euro Corporates; Peer group sector: Morningstar EUR Corporate Bond, 18 December 2009 to 31 March 2020. See tables at end of article for further performance information.
Past performance is not a guide to future performance.
What makes this episode interesting is that there are certain parallels with today. The most obvious is that it highlights a common thread with investing: crises induce panic. Panic induces a fight-or-flight response in humans. This typically translates into flight as investors withdraw from the market and favour cash. For the European investment grade corporate bond market, this caused spreads to rise to 240 basis points (bps) and the yield to climb to 1.9% by 24 March 2020 at the height of the panic. Consider that they were just 94bps and 0.3% as recently as the end of January 2020 and you get some scale of the price correction. They have since subsided to a spread of 200 basis points and a yield of 1.4% at 15 April 2020, but remain elevated.1
1Source: Bloomberg, ICE BofA Euro Corporate Bond Index, spread to worst versus government, yield to worst. Yields may vary and are not guaranteed.
There is justification for the widening in spreads. The world today is clearly in a very different position to where it was before the COVID-19 pandemic outbreak. Credit lines with banks are being drawn. Dividends are being cut and capital is being raised on both debt and equity markets.
Businesses are retrenching. One company’s cost saving is another company’s lost revenue and the rise in unemployment has already damaged consumer sentiment. We should therefore not underestimate the knock-on effects presented by dealing with the virus and closing down whole swathes of the economy. This will be painful for many companies. The investment bank Morgan Stanley estimates that earnings per share will tumble 25% 2 in Europe in 2020, although cynically we can probably expect companies to use coronavirus as an excuse to get all their bad news out of the way this year.
2Source: Morgan Stanley, 19 March 2020. Based on companies within the MSCI Europe Index. Base case assumption. Forecasts are estimates and are not guaranteed.
In this environment we would argue that investment grade corporate bonds are looking relatively attractive as an asset class. Investment grade companies are, by definition, typically better capitalised and have more robust cash flows than their sub-investment grade peers. This should stand them in better stead to weather the lockdown and permit access to capital markets. There has been a flurry of activity already, with almost €49 billion raised in non-financial investment grade corporates and €12 billion in senior bonds from financials in the month of March alone according to figures from Bloomberg. Amid the current uncertainty, corporate treasurers are likely to want to secure term funding and so are taking advantage of markets that have reopened after central banks announced fresh liquidity injections and asset purchase schemes. The European Central Bank (ECB)’s Pandemic Emergency Purchase Programme allows the ECB to buy assets totalling €750 billion by the end of this year. While these are spread across sovereign bonds and investment grade corporate bonds there is no specific monthly limit, so it can be front-loaded during the crisis.
We believe investment grade bonds also appear attractive relative to equities. They rank senior to equity in the capital structure and therefore face less of a capital threat than equity. Income also ought to be more secure. Many companies are cutting or cancelling their dividends in an effort to preserve cash within the company. In the case of the banks, equity dividends (which were discretionary at the best of times), are being forcibly scrapped by authorities across Europe as a pre-requisite for banks to participate in their support schemes. Several insurance companies have also scrapped their dividends. In contrast, coupons from bonds appear safe from regulators, at least for now.
Which brings us to the point of whether investment grade corporate bonds might be attractive in absolute terms. The spread on euro investment grade corporate bonds of 200 basis points on 15 April 2020 is well above the average of the last 20 years (see Figure 2 below). In fact, this level of spread has only been seen before during the global financial crisis of 2008-9 and the height of the eurozone crisis in 2011-12 when an unravelling of the euro seemed a distinct possibility. In both instances buying at current spread levels, investors would have made a positive return if holding the bonds for a year. That is not to say that spreads could not gap wider from here. We have to be mindful that negative developments in COVID-19 or difficulties in exiting the economic lockdown could easily see risk aversion return and bond prices fall.
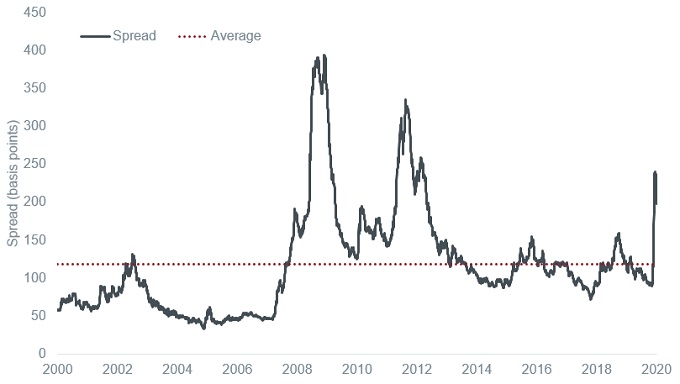
Source: Bloomberg, ICE BofA Euro Corporate Index, spread to worst versus government, 14 April 2000 to 15 April 2020.
Past performance is not a guide to future performance.
Returning to our opening proposition, it is clear that investors could potentially have benefited from an even stronger return had the fund been launched when the Global Financial Crisis was at its peak. It takes courage to invest at such times. Investors will also notice from the chart on spreads above that it was not all plain sailing from 2009. The markets were volatile over the next three years as concerns about sovereign debt levels and the survival of the eurozone escalated, but the fund was able to deliver a positive return in each of those calendar years (2010, 2011 and 2012).
The current crisis clearly differs from the global financial crisis in that this is an exogenous shock and developments in dealing with COVID-19 will determine the speed of economic recovery. The longer the economic lockdown persists the greater the challenge to solvency for companies. We believe the fiscal and monetary measures in Europe and elsewhere help address concerns but ultimately each corporate borrower is different and careful fundamental analysis is key to determining whether a bond offers value.
As with 2009, the knock-on effects of the initial crisis may be felt for months and years to come so we believe that an active approach to investing in corporate bonds is warranted. In that regard, we would draw your attention to distinct characteristics of the fund:
There is no certainty that the next ten years will follow a similar trajectory to the last ten years. We have to be mindful that new risks and opportunities will present themselves. The outlook for inflation is more uncertain as a stalled global economy meets vast fiscal and monetary stimulus. Duration and credit management will therefore both have roles to play in the years ahead.
Fund objective: The Fund aims to provide a return, from a combination of income and capital growth over the long term.
Performance target: To outperform the iBoxx Euro Corporates Index by 1.5% per annum, before the deduction of charges, over any 5 year period.
The Fund invests at least 80% of its assets in investment grade corporate bonds and other types of investment grade bonds, denominated in Euros.
The Fund is actively managed with reference to the iBoxx Euro Corporates Index, which is broadly representative of the bonds in which it may invest, as this forms the basis of the Fund’s performance target. The investment manager has discretion to choose investments for the Fund with weightings different to the index or not in the index, but at times the Fund may hold investments similar to the index.
| Performance % | A2 EUR (Net) | Index | Sector | Quartile ranking | A2 EUR (Gross) | Target (Gross) |
|---|---|---|---|---|---|---|
| 1 month | -7.0 | -6.9 | -6.8 | 2 | – | – |
| YTD | -6.3 | -6.2 | -6.4 | 2 | – | – |
| 1year | -3.4 | -3.4 | -3.8 | 2 | – | – |
| 3 years (annualised) | 0.2 | 0.2 | -0.5 | 1 | – | – |
| 5 years (annualised) | 0.3 | 0.7 | 0.1 | 2 | 1.4 | 2.2 |
| 10 years (annualised) | 3.9 | 3.1 | 2.6 | 1 | 5.3 | 4.7 |
| Since inception (annualised) | 4.2 | 3.3 | 2.8 | 1 | 5.6 | 4.8 |
| Discrete year performance % | A2 EUR (Net) | Index | Sector | A2 EUR (Gross) | Target (Gross) |
|---|---|---|---|---|---|
| 01/04/2019 – 31/03/2020 | -3.4 | -3.4 | -3.9 | -2.3 | -1.9 |
| 01/04/2018 – 31/03/2019 | 2.4 | 2.3 | 1.2 | 3.6 | 3.8 |
| 01/04/2017 – 31/03/2018 | 1.7 | 1.7 | 1.3 | 2.9 | 3.2 |
| 01/04/2016 – 31/03/2017 | 3.0 | 2.5 | 2.9 | 4.2 | 4.0 |
| 01/04/2015 – 31/03/2016 | -2.2 | 0.4 | -0.8 | -1.1 | 1.9 |
Source: Morningstar, All rights reserved, at 31 March 2020, Performance is with gross income reinvested, in euro. Fund: Janus Henderson Horizon Euro Corporate Bond Fund A2 EUR share class. This is the representative share class. Performance may differ from above depending on the share class. Index: Markit iBoxx Euro Corporates; Sector: Morningstar EUR Corporate Bond, 18 December 2009 to 31 March 2020. Performance/performance target related data will display only where relevant to the share class inception date and annualised target time period. The performance does not take account of any initial charge and Janus Henderson does not levy a redemption charge. Source for target returns, where applicable is Janus Henderson. Where quartiles are shown, 1st quartile means the share class is ranked in the top 25% of share classes in its sector.
Past performance is not a guide to future performance