Subscribe
Sign up for timely perspectives delivered to your inbox.


Danny Greenberger and Greg Kuhl, Global Property Equities Portfolio Managers, and Suny Park, Head of Institutional Client Strategy, North America, encourage institutional investors to reassess REITs as a strategic return-enhancing asset class. REITs can act as a complement to private real estate and offer investors broader exposure to specialty property sectors with greater growth opportunities.
In recent years, institutional investors have turned to private investments – private equity, private debt and private real estate – in search of higher returns. Simply having the word ‘private’ in front of any investment seems to conjure up higher expected returns among investors. Asset flows confirm this view: all three private asset classes mentioned have witnessed steady asset growth while listed equities and bonds have witnessed steady outflows.
At the broad asset class level, it is undeniable that private equities and private debt have meaningfully outperformed their listed counterparts for the past 20 years; however, the same cannot be said of private real estate versus listed real estate. In fact, at the index level, listed real estate (REITs) as represented by the FTSE Nareit All Equity Index (the Nareit Index) has handily outpaced the NCREIF ODCE (Open-End Diversified Core Equity) Index by 2.9% per year (on a gross basis) and by 1.1% per year (on an unlevered basis) for the past 20 years ended 31 December 2021.2 Our research indicates greater cash flow growth from specialty property sectors, by definition absent from private core real estate funds, primarily explains the historical outperformance of REITs over private open-end diversified core real estate funds.
Many private open-end diversified core real estate funds concentrate their investments in retail and office, yesteryear’s bellwether properties now subject to oversupply, increasing operating challenges and excessive amounts of required capital investments. In contrast, REITs offer unique access to ‘non-core’ property types – traditionally outside private core property sectors – with superior future cash flow growth prospects coupled with daily liquidity, regulated financial disclosures and alignment of interests between company managements and investors. That REITs exhibit over 90% correlation to private real estate (when adjusted for performance lag3) solidifies REITs as a highly relevant and complementary asset to private real estate for institutional investors in gaining a broader exposure to real estate as an asset class. Therefore, institutional investors who neglect REITs as a return-enhancing strategic asset class risk missing an opportunity to achieve a broader exposure to all real estate sectors – regardless of vehicle type – and to gain access to specialty property with greater growth opportunities such as single tenant net lease, manufactured housing, self storage, cell towers and data centers.
Generally speaking, institutional investors take a core-satellite approach to real estate allocations, as stylized in Exhibit 1.
Exhibit 1: Institutional Real Estate Structure
Stylized real estate allocation structure for illustrative purposes only.
Plan sponsors obtain their largest real estate exposure through core real estate funds – strategies generally constrained by both property sectors and leverage levels. These core funds offer periodic liquidity and hold stable operating assets across office, retail, apartment and industrial properties. Plan sponsors complement this core allocation with value-added and opportunistic funds – ‘go anywhere’ closed-end vehicles unconstrained by property type with generally higher leverage profiles. While allocations to private core, value-added and opportunistic real estate strategies have steadily increased over the past 20 years, allocations to REITs have been negligible, averaging about 0.6%4 of total plan assets.
We observe a cognitive dissonance in institutional investors’ asset allocation behaviors. As of 31 December 2021, the market capitalization of the Nareit Index approximated $1.66 trillion USD, comparable in size to the Bloomberg Barclays US High Yield Index’s market capitalization of $1.65 trillion USD. Even though comparable in size, U.S. public plans have allocated almost six times as much capital (between 3.0% and 4.0% of plan assets) to U.S. high yield as they have to U.S. REITs. Hence our assertion: despite its size, institutional investors have historically neglected REITs as a return-enhancing strategic asset class.
In the past, investors have viewed private real estate investing as a lower-risk strategy when compared to listed real estate strategies, generally not subject to market gyrations; however, the CBI examination demonstrates that this perceived lower risk is entirely due to a long reporting lag relative to when actual changes in underlying property values materialize. This lag in private real estate returns is attributable to the industry’s standard practice of appraising only 25% of the underlying properties on a quarterly basis and relying on broker opinions of value for the remaining 75% of the properties to estimate periodic returns. Due to timing and reliance on historical comparable transactions to estimate property values, the performance measurement of private real estate funds is significantly delayed and does not fully reflect the true market clearing price of their underlying properties.
U.S. institutional investors witnessed this lag firsthand during the 2008-2009 Global Financial Crisis – a period characterized by paucity in private market activity. For the 200 U.S. pension plans analyzed by CBI, REITs experienced a sharp sell-off of 38% in 2008. Private real estate funds suffered the same 38% loss; however, they reported the loss over a two year period, publishing a modest loss of 8% in 2008 before reporting a much larger 30% loss in 2009, as shown in Exhibit 2A.
Exhibit 2A: CBI As-Reported Private Real Estate Fund Performance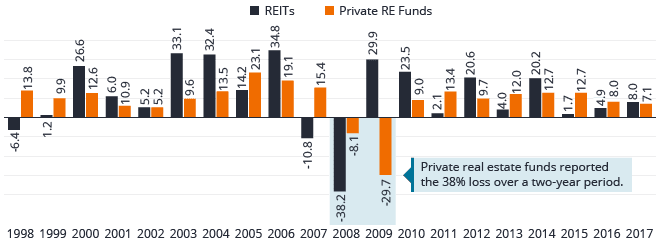 Exhibit 2B: CBI Standardized Private Real Estate Fund Performance
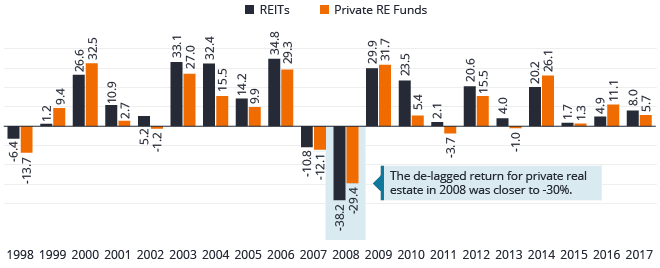
CBI’s bottom-up, plan level analysis indicated private real estate funds systematically exhibit reporting lags averaging one year. Therefore, CBI standardized private real estate fund returns by de-lagging reported historical returns adjusted for comparable leverage.
Once private real estate funds’ as-reported returns have been standardized, they exhibit a much higher correlation of 0.9 with REITs, as shown in Exhibit 2B. This result should not come as a surprise to anyone since both REITs and private real estate funds invest in commercial real estate properties. Just as equities are equities, whether listed or private, real estate is real estate whether accessed through REITs or through private real estate funds.
Previously, we remarked, “… the Nareit Index has handily outpaced the NCREIF ODCE Index by 2.9% per year (on a gross basis) and by 1.1% per year (on an unlevered basis) for the past 20 years ended 31 December 2021.” REITs have also outperformed Value-Added and Opportunistic composites on a net-of-fee basis.
Exhibit 3A: Net of Fees, REITs Outperform All Private Real Estate Funds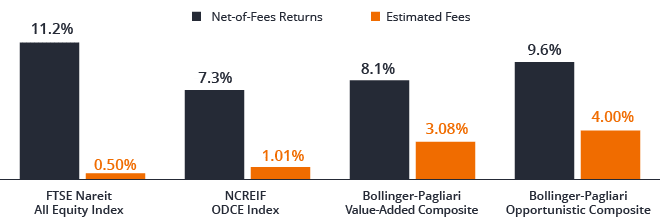
| Estimated | Returns | ||||||
|---|---|---|---|---|---|---|---|
| Description | Debt-to-Assets | Fees | Gross Levered | Net of Fees Levered | Gross Unlevered | Standard Deviation | Sharpe Ratio |
| [A] | [B] | [C] | [D] | [E] | |||
| FTSE NAREIT All Equity Index | 36.6% | 0.50% | 11.7% | 11.2% | 7.8% | 20.9% | 0.35 |
| NCREIF ODCE Index | 22.0% | 1.01% | 8.3% | 7.3% | 6.5% | 11.8% | 0.51 |
| Bollinger-Pagliari Value-Added Composite | 29.3% | 3.08% | 11.1% | 8.1% | 7.9% | 17.4% | 0.42 |
| Bollinger-Pagliari Opportunistic Composite | 36.6% | 4.00% | 13.6% | 9.6% | 8.6% | 19.0% | 0.42 |
| US 3-MO Tbill | 0.5% | ||||||
| FTSE NAREIT Outperformance Over ODCE (2000 – 2017) | 3.3% | 1.3% | |||||
| FTSE NAREIT Outperformance Over ODCE – 20 Years Ended on 12/31/2021 | 2.9% | 1.1% | |||||
| FTSE NAREIT Outperformance Over ODCE – 10 Years Ended on 12/31/2021 | 1.8% | -0.2% | |||||
For the Bollinger-Pagliari examination period from 2000 – 2017, after deducting estimated investment management fees, REITs outpaced the NCREIF ODCE Index by 3.9%, the Value-Added Composite by 3.1% and the Opportunistic Composite by 1.6% per year. A word of caution about comparative returns is in order: due to the varying debt-to-asset leverage ratios across these four indices, the net-of-fees returns are not fully comparable across different investment strategies, and for that reason, estimated leverage ratios, fees and gross unlevered returns are shown in Exhibit 3B columns [A], [B], and [E], respectively.
At first glance, it may appear that historical returns for REITs have been higher than the ODCE Index simply due to higher volatility levels; that is, REITs generated higher returns because they represented a riskier investment strategy. Seasoned investors recognize that comparing risk estimates across daily-marked listed securities and quarterly-estimated private securities is fraught with estimation errors due to differences in valuation methodology, mark-to-market or valuation frequency and a lag in performance reporting by private real estate strategies. By simply smoothing the monthly returns on a rolling three-month basis, the volatility estimate for REITs drops from 21% to 12%5, bringing it closer to that of the ODCE Index. Therefore, we advise against drawing any return per unit-of-risk conclusions based on highly questionable risk estimates for private real estate strategies.
The listed real estate market’s early embrace of specialty property sectors has been an important driver of the return differential between REITs and private ODCE funds. As shown in Exhibit 4A, as of 31 December 2021, non-core property sectors were noticeably absent from the NCREIF Property Index (NPI), whereas, they accounted for 59% of the Nareit Index. And as shown in Exhibit 4B, non-core sectors have grown from 26% in October 1999 to 59% in December 2021 of the Nareit index.
Exhibit 4A: Comparative Sector Allocation – NPI vs. Nareit Index
Due to their differentiated operating platforms and the granularity of their individual property holdings, in our opinion, specialty property types including single tenant net lease, manufactured housing, self storage, cell towers, and data centers, among others, are more commonly found in, and better suited to, the listed market. And that explains the divergence of sector allocation between the Nareit Index and the NCREIF Property Index. By their very nature, investments in specialty property types tend not to be compatible with the structure and cadence of private equity capital raising, investment, and distribution of capital. Individual properties in sectors like self storage and single tenant retail often have property values between $1 million and $10 million. Even industrial properties – a core real estate property type – averaged $15 million in transactional value in 2018. In comparison, average transactional values for office, retail, or apartment properties ranged from $20 to $35 million in 2018. The fact that for every property acquired, many more are underwritten and rejected, demonstrates why private real estate managers find it easier to expediently deploy capital in retail, office, and apartments – fewer but larger transactional value property types.
By contrast, REITs represent infinite-lived vehicles that can continuously raise and deploy capital on an opportunistic basis. This permanent capital structure is much more conducive to assembling a portfolio of smaller transactional value assets, which can take years or decades to reach a critical mass. While it is relatively straightforward for a private real estate manager to underwrite the next seven years of cash flows for an office building, it is generally more difficult to find highly qualified underwriters and capital allocators with specialized knowledge of manufactured housing, data centers, or cell towers. In our opinion, specialty managers in sectors like these are more often found in REITs, not in private real estate managers who tend to be more financial, rather than operational in focus.
We expect non-core specialty sectors to continue to outpace core sectors due to higher initial unlevered yields, demand-driven higher secular growth leading to landlord pricing power, and generally lower recurring capital expenditures supportive of higher free cash flow growth. For indicative purposes, in Exhibit 5, we set forth long-term returns projections for all major sectors of the Nareit Index, excluding mortgage REITs.
| Description | Type | Levered Growth | Dividend Yield | Dividend Payout Ratio | Total Return | NCREIF Weight | NAREIT Weight |
|---|---|---|---|---|---|---|---|
| Technology Infrastructure | Non-Core | 7.0% | 2.0% | 46.1% | 9.0% | 16.2% | |
| Specialty | Non-Core | 5.5% | 4.5% | 76.7% | 10.0% | 4.3% | |
| Free Standing Retail | Non-Core | 3.5% | 4.2% | 75.4% | 7.7% | 4.8% | |
| Industrial | Core | 6.0% | 1.7% | 71.6% | 7.7% | 27.7% | 13.5% |
| Data Centers | Non-Core | 5.5% | 1.9% | 41.6% | 7.4% | 8.2% | |
| Regional Malls | Core | -1.0% | 4.1% | 87.5% | 3.1% | 7.7% | 3.4% |
| Health Care | Non-Core | 3.0% | 4.1% | 85.5% | 7.1% | 7.7% | |
| Diversified | Non-Core | 4.0% | 4.0% | 84.1% | 8.0% | 2.4% | |
| Manufactured Homes | Non-Core | 6.5% | 1.6% | 61.4% | 8.1% | 2.4% | |
| Shopping Centers | Core | 2.5% | 3.2% | 90.6% | 5.7% | 7.7% | 4.2% |
| Office | Core | 2.0% | 3.4% | 79.1% | 5.4% | 30.1% | 6.8% |
| Single Family Rental Homes | Non-Core | 7.5% | 1.3% | 32.5% | 8.8% | 2.5% | |
| Self Storage | Non-Core | 8.0% | 2.3% | 78.9% | 10.3% | 7.6% | |
| Apartments | Core | 6.0% | 2.5% | 70.2% | 8.5% | 26.5% | 11.0% |
| Lodging/Resorts | Core | 2.0% | 0.1% | 68.1% | 2.1% | 0.3% | 2.5% |
| Timber | Non-Core | 2.0% | 1.9% | 102.5% | 3.9% | 2.5% | |
| Overall Average | 4.4% | 2.7% | 72.0% | 7.0% | |||
| Core Average | 2.9% | 2.5% | 77.9% | 5.4% | |||
| Non-Core Average | 5.3% | 2.8% | 68.5% | 8.0% | |||
| Core % in NAREIT Index | 41.42% | ||||||
| Non-Core % in NAREIT Index | 58.58% |
As of 12/2021
As remarked previously, because private real estate managers find it more difficult to expediently deploy capital in specialty property types, and the latter, oftentimes, requires differentiated property management capabilities and is generally incompatible with private fund structures, institutional investors have historically been under-invested in these specialty sectors, resulting in relatively higher initial unlevered yields compared with core property types.
In addition, specialty sectors have disproportionately benefited from secular demand that has driven rental rate and occupancy growth ahead of those experienced by core sectors. For example, the age-restricted manufactured housing REITs are capitalizing on younger retirees’ appetite for affordable active adult residential accommodations, while cell tower landlords endeavor to meet the ever increasing mobile data demands of today’s consumers and businesses. Both property types face minimal oncoming supply due to onerous zoning and entitlement processes for developments while demand continues to steadily grow, largely independent of business cycles.
Finally, specialty properties generally require lower levels of maintenance capital expenditure – defensive capital projects that maintain competitive relevance of real estate properties. Office and retail properties, which comprised 45% of the NCREIF Property Index as of December 2021, currently require maintenance capital spending upwards of 30%6 of annual operating cash flow. In contrast, specialty sub-sectors, such as self-storage and single-tenant net lease, require maintenance capital expenditures of less than 5%6 of annual operating cash flow. In our opinion, real estate investors have consistently underappreciated the magnitude and impact of annual capitalDaily liquidity of REITs is an important asset allocation and risk management tool generally not available to private real estate managers. Evolving property market fundamentals are visible to both private and listed real estate investors; however, only listed real estate managers can adapt their sector allocations over the course of days or weeks – at a minimal transaction cost – to take advantage of emerging secular growth trends or to limit exposures to sectors facing increasing secular headwinds. The weakening position of retail landlords and the strengthening position of their logistics warehouse brethren have been evident for several years. Real estate managers would have done well to dramatically reduce their exposures to the retail sector while increasing exposure to the industrial sector to position the portfolio to changing industry fundamentals, as well as to anticipated changes in asset prices. Compared to private real estate managers, REIT managers have the potential to be much more dynamic and adaptive in sector allocations and portfolio risk management.
As listed securities, REITs experience short-term pricing fluctuations whereby portfolios can occasionally trade below their net asset value (NAV) – a proxy for private market liquidation value. Active REIT managers can tactically reposition portfolio holdings during periods of such volatility to take advantage of opportunistic pricing and therefore acquire real estate assets at a discount to private market value. Since private real estate sales are lengthy negotiated transactions and reported values rarely decline, this type of tactical trade is less likely to be available in the private world. By taking advantage of short-term price volatility and the inherent liquidity in the listed REIT market, active REIT managers can augment returns in a way private real estate managers cannot.
REITs have delivered low double digit net-of-fee returns since the turn of the century, as the asset class has grown and matured. Within the Nareit Index, the majority of real estate companies reside outside traditional core real estate sectors. Given the attractive traits such as expected supply constraints, durable demand and higher initial unlevered yields, long-term growth prospects for specialty sectors remain strong moving forward. A comparison of estimated long-term forward returns indicates specialty property is poised to deliver faster cash flow growth and greater total return relative to traditional core real estate sectors. Moreover, secular headwinds facing core sectors such as retail and office strongly suggest more private property write-downs are waiting in the wings, which may lead to a wider performance divergence between core and noncore sectors of the real estate market.
Despite a steadily growing market, REITs have been a forgotten asset class among institutional investors. In the not so distant future, the REIT market is likely to further expand its breadth of specialty sectors, as recently introduced assets in cold-storage, marinas, and affordable housing continue to grow. If the past 20 years of listed real estate experience is any guide, it behooves institutional investors to reassess REITs as a strategic return-enhancing asset class deserving of their attention. Our advice is not to supplant but rather to supplement a private real estate allocation with a REIT allocation because, in our opinion, the latter will not only offer institutional investors more complete exposure to all real estate sectors, but may improve risk-adjusted returns of the entire real estate structure.
1 https://www.reit.com/news/reit-magazine/november-december-2013/beginnings-era.