Subscribe
Sign up for timely perspectives delivered to your inbox.
April 2020
Investors’ mass exodus from risky assets such as corporate credits has likely resulted in attractive valuations for financially stable issuers – especially now that central banks have deployed large volumes of liquidity to calm markets.
The bond sell-off over the past month has been extreme, with global growth concerns and market illiquidity weighing on riskier assets. Market moves for the four-week period ending March 20 either nearly matched, or slightly exceeded, the deepest of the four-week drawdowns registered during the Global Financial Crisis (GFC).
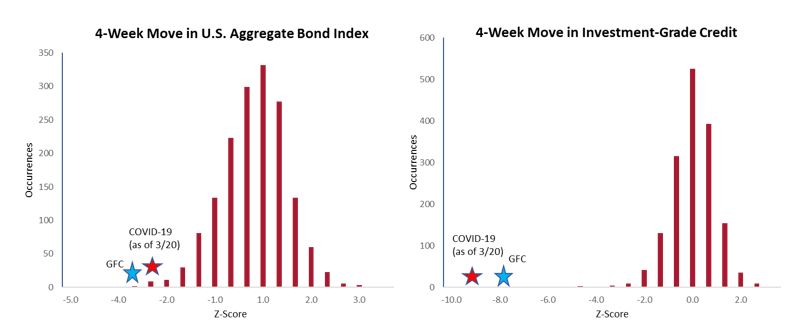 Source: Bloomberg, data as of 1/1/89 – 3/20/20. All indices Bloomberg Barclays. Investment-grade credit = BB U.S. Corporate Credit Index. Z-score measures the standard deviation from the mean, which is represented by zero.[/caption]
This month’s rush for liquidity has been acutely felt in short-term lending markets, leading to a pronounced spike in rates and prompting the Federal Reserve (Fed) to aim much of its firepower at this segment of the market.
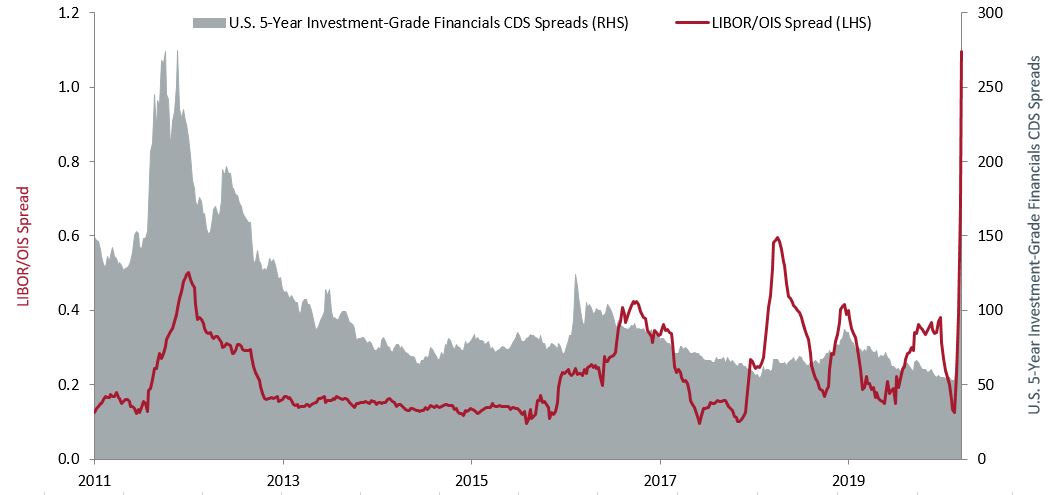 Source: Bloomberg, data as of 3/20/20. Based on spread between U.S. 3-month LIBOR and U.S. Overnight Indexed Swap (OIS) rate. LIBOR represents the interest rate banks charge each other for short-term borrowing. OIS is the daily rate counterparties exchange fixed interest payments for floating interest payments and, thus, implicitly carries less credit risk as principal is not exchanged. [/caption]
Investor preference for safety and liquidity was also reflected by correlations. Riskier asset classes, such as equities and high-yield bonds, demonstrated higher correlations, while traditionally safer assets, such as Treasuries, diverged. (Correlation measures the degree to which two securities move in relation to each other. Values closer to 1.0 suggest a positive relationship (i.e., moving in the same direction), while values closer to -1.0 suggest a negative relationship.)
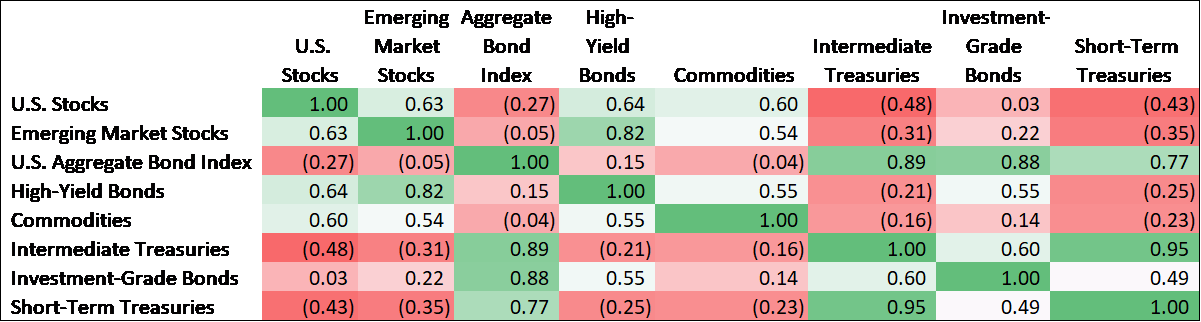 Source: Bloomberg. Daily correlations from 1/3/20 – 3/23/20. Based on S&P 500® Index (U.S. Stocks), MSCI Emerging Market Index (Emerging Market Stocks), U.S. Aggregate Bond Index (Aggregate Bonds), U.S. Corporate High-Yield Index (High- Yield Bonds), S&PGSCI Index (Commodities), U.S. Intermediate Treasuries Index (Intermediate Treasuries), U.S. Aggregate Corporate Credit Index (Investment-Grade Bonds), U.S. 1-3 Year Treasury Index (Short-Term Treasuries).[/caption]
Facing a dramatic economic slowdown and market illiquidity, the Fed announced it would essentially make unlimited asset purchases, buying not only Treasuries and mortgage-backed securities but also corporate credits and certain exchange-traded funds, if needed.
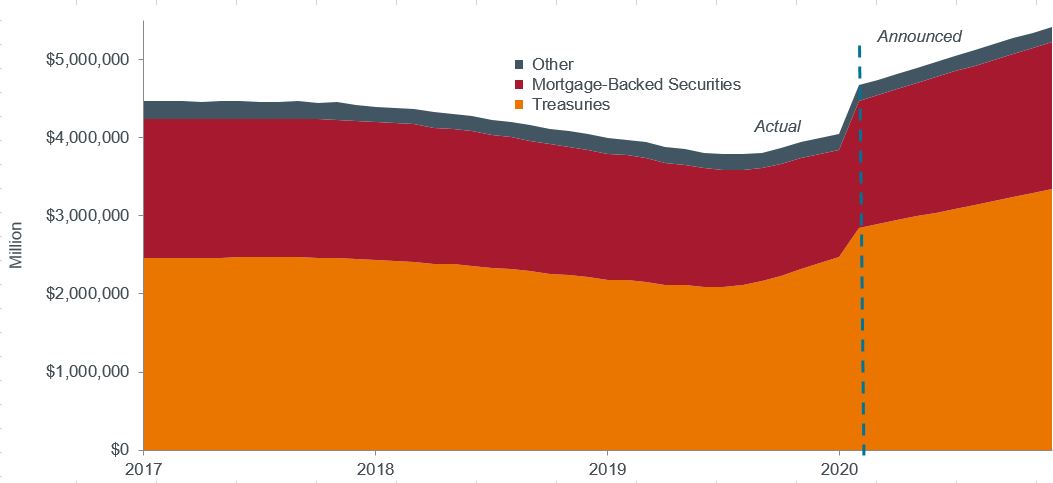 Source: Bloomberg, data as of 3/25/20.[/caption]
The Fed also lowered its benchmark rate to between 0.0% and 0.25%. Other major central banks, with already low to negative policy rates, are more dependent upon asset purchases, which are slated to increase considerably.
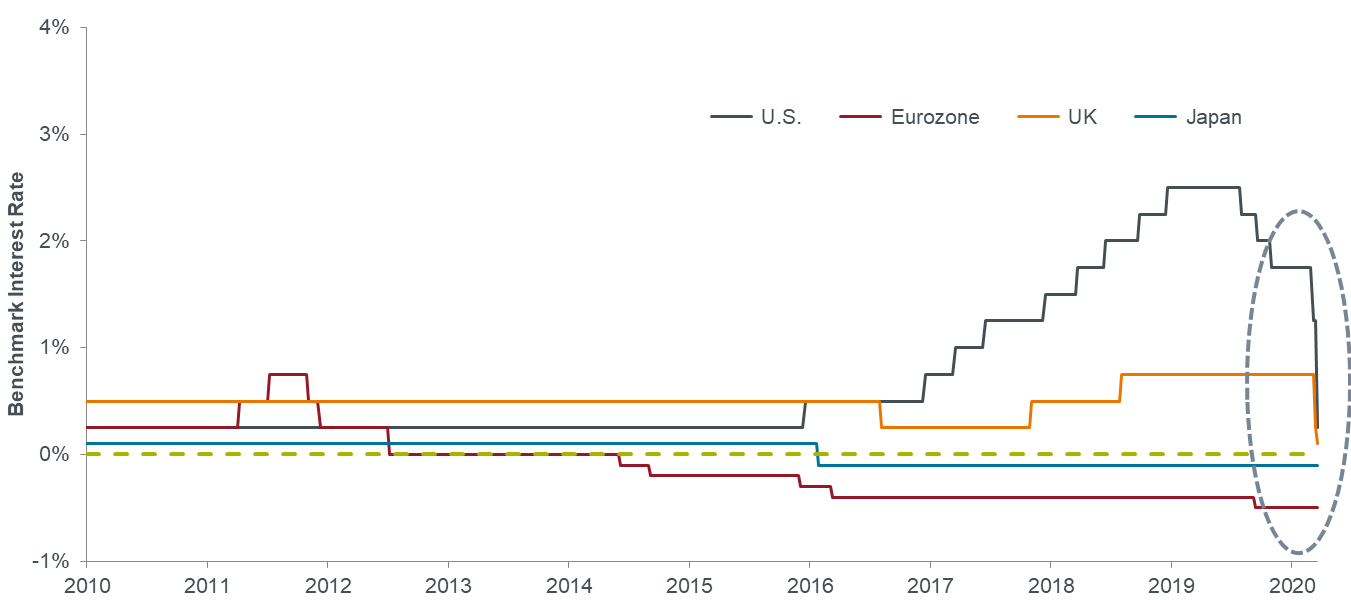 Source: Bloomberg, data as of 3/20/20.[/caption]
Historically, extreme volatility tends to be short-lived, and as volatility and yield spreads revert to long-term averages, bonds have delivered attractive returns. Looking at five examples of high-volatility periods over the past 20 years, investment-grade credits have averaged 8.4% annualized returns over the three years following the peak in volatility, up from 5.4% for the period as a whole. For high-yield bonds, three-year annualized post-peak returns are 10%, compared to 6.1% for the entire period.
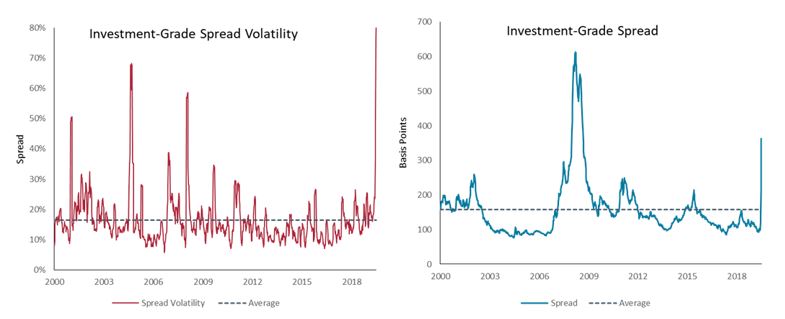 Source: Bloomberg, data as of 3/20/20. A basis point is 1/100 of a percent. [/caption]
Similarly, after some of the worst four-week market sell-offs in recent history, the U.S. Aggregate Bond Index has returned an average of 6% annualized over the ensuing 36 months. For investment-grade and high-yield corporate bonds, performance was even better, returning 7.3% and 12%, respectively.
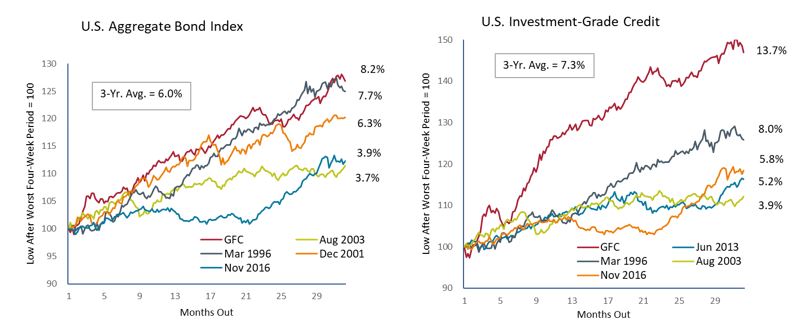 Source: Bloomberg, data as of 3/20/20. Past performance is not a guide to future returns. Baseline four-week period for U.S. Aggregate Bond Index drawdowns are 10/10/08, 8/1/03, 3/8/96, 12/7/01 and 11/18/16. Baselines for Investment-Grade Credit drawdowns are 10/10/08, 6/21/13, 3/8/96, 8/1/03 and 11/18/16.[/caption]
For much of the post-GFC era, the risk/return of bonds appeared upside down. Low yields meant that only a slight move higher in interest rates could wipe out a year’s worth of expected returns (bond prices move opposite to yield). That has changed in recent weeks for several segments of the market.
Higher yields and wider spread cushions now imply that short-dated corporate credits and high-yield bonds can absorb more than a two-percentage point rise in interest rates before losing value, a scenario that is highly unlikely given the Fed’s commitment to 0% interest rates, or “the zero-bound.”
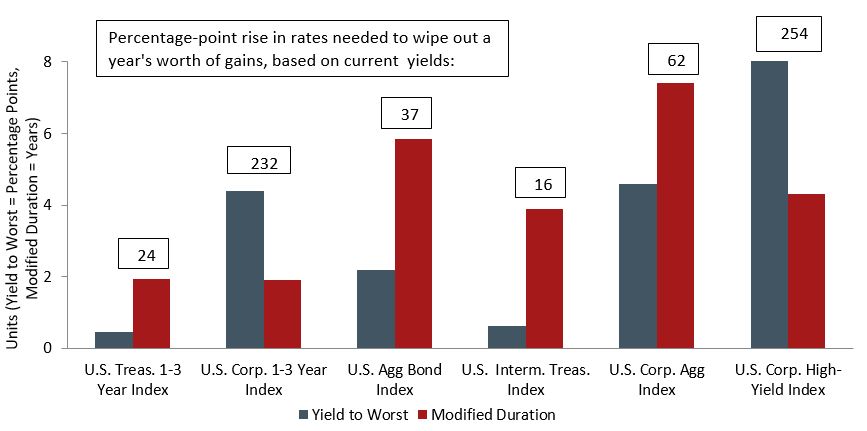 Source: Bloomberg, data as of 3/20/20. Duration is a measure of a bond price’s sensitivity to changes in interest rates. Units of Yield to Worst in Percentage Points, Modified Duration in Years.[/caption]
Subscribe for relevant insights delivered straight to your inbox