Subscribe
Sign up for timely perspectives delivered to your inbox.


Portfolio Managers Seth Meyer and Brent Olson and Fixed Income Risk Manager Nirav Thakkar discuss their analysis of high-yield spread distributions over the last decade and share their findings on whether tight spreads may indicate an increased risk of weak performance in the future.
The U.S. high-yield market had a strong year in 2019, with the Bloomberg Barclays U.S. High Yield Index returning 14.3% as its spread over U.S. Treasuries tightened to historically low levels. Such a formidable run raises justifiable questions about what investors can expect in 2020. Does strong past performance increase the risk of weaker performance in the year ahead?
To help answer this question, we looked at the distribution of high-yield spreads over the last decade (2009-2019). The average spread during this period was 532 basis points (bps), just over 200 bps wider than the 329 bps reached at the end of 2019, putting the year-end levels in the top (tightest) 10% of the decade’s spreads. These heights are dizzying – and rare: High-yield spreads have only reached this top decile five times in the last decade, and at each of those times, spreads eventually widened. But, as shown in the chart below, the amount of widening and the time spreads took to widen varies.
[caption id=”attachment_272533″ align=”alignnone” width=”641″]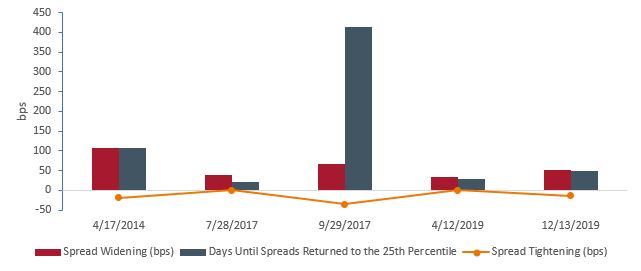 Source: Bloomberg Barclays, as of 1/31/2020[/caption]
The median amount of widening that occurred to get spreads back to the 25th percentile (still on the “tight” side of the mean, but not at the extreme tights of the 10th percentile), was 52 bps. The spread widening was never instantaneous after reaching the 10th percentile but took anywhere from 21 to 413 days to return to the 25th percentile. The amount of time is important because the yield earned during those extended periods provided some cushion against the drawdown caused by the spread widening (as bond prices move inversely to yields).
In the September 2017 period, for example, spreads widened 65 bps before reaching the 25th percentile, yet the index returned a positive 1.9% total return over the period. The reason: It took over a year (413 days) for the spread widening to occur, and a substantial amount of yield was earned during that period.
Even the 2014 widening, which at 106 bps was the most extreme of our identified periods, took 100 days. The sum of the loss from over 100 bps of widening, plus the yield earned over 100 days, resulted in a modestly negative return of -1.1%.
The remaining three instances (July 2017, April 2019 and December 2019) resulted in negative period returns, as there was little time to accumulate offsetting yield income. However, even these losses were relatively limited (at around -1%), as the spread widening was more modest, averaging 42 bps. Furthermore, just because spreads reached the 10th percentile didn’t mean they began to widen immediately. As shown by the orange line in our chart above, in three of our five periods, spreads continued to tighten before eventually widening.
The combination of possible further spread tightening – even at historically tight levels – and the possibility of income from yield offsetting the potential losses from eventual spread widening prompted us to look at high-yield bonds’ history from another angle: What was the total return realized if an investor bought the high-yield index any time spreads were in the 10th percentile and held onto that position?
Over the past decade, buying and holding for one month generated a positive total return 51% of the time, while buying and holding the index for three months generated a positive total return 58% of the time. If the index was held for a year, however, a positive total return was realized 89% of the time. Thus, in the high-yield market (with apologies to the Rolling Stones), time is on the investor’s side. Which is to say, longer, strategic holding periods can go a long way toward providing a cushion against possible spread widening.
Given that the level of spread tightening reached at the end of 2019 is rare, there is little data to infer patterns or make predictions about when or how much widening may occur in 2020. Evaluating the individual companies that comprise the high-yield index and being mindful of the market environment – including the relationship between high-yield valuations and other credit or risk markets – is critically important in assessing the risk of spread widening.
However, history shows us that simply being at tight spread levels does not automatically imply a high probability of a swift and severe spread widening. On the contrary, spreads sometimes tightened further and, depending on how long it took for spreads to widen, total returns throughout a period of correction could still be positive.
Regardless of the short-term changes in high-yield spreads, the high percentage of positive one-year returns after periods of tight spreads is a reminder that the asset class is well named: The high yields paid can act as ballast in times of spread widening. Even though high yield ended 2019 in the top decile of spreads over the last decade, we maintain our view that it is an attractive asset class for strategic, long-term portfolio allocations. But we also believe that more tactical, active management can help minimize volatility and potentially reduce drawdown during periods of spread correction.