Knowledge. Shared Blog
January 2020
Low Return Dispersion, High Correlations Point to “Groupthink” in Equity Markets
No bios have been selected to display.Forecasts for 2020 abound, but market efficiency makes these prognostications difficult to exploit in a directional sense. Instead, by examining the relative behavior of stocks, we attempt to offer an integrated view of equity-market opportunities and risks.
Key Takeaways
- Relative return dispersion is historically low in many equity markets around the world, while correlations of stock returns have soared.
- This combination of low dispersion and high correlations points to a “groupthink” mentality, causing an unjustified sense of security and leaving fewer places to hide when volatility increases.
- The potential consequences for a changing market environment require investors’ full attention on equities – irrespective of asset allocation. We believe a defensive mindset is essential, as well as the inclusion of strategies that offer the potential for complementary returns and comprehensive risk controls.
With more than 120 global strategy outlook papers published on the Savvy Investor Network in the final two months of 2019, there is an abundance of traditional forecasts pointing to future investment opportunities. These views are difficult to capitalize on: Even if market participants exploit them faster than a forecaster can publish them, the market may refuse to do the “rational” thing for longer than active managers can maintain their bets.
Rather than making forecasts based on economic assumptions, we take a more integrated view of equity market opportunities, focusing on the interactions between stocks as they form components of a portfolio. Which tail risks are most likely to materialize? And, once they materialize, which ones are likely to be the most disruptive? We hope to shed light on those questions without directionally forecasting.
Increasing Signs of Tail Risk
Today, we observe that relative return dispersion is historically low in many equity markets around the world. Return dispersion is also known as cross-sectional volatility: It measures whether stocks’ returns are converging (low dispersion) or diverging (high dispersion) relative to their benchmark. Low dispersion tends to be indicative of excessive groupthink, so it’s usually an indicator of underlying market strain.
In the chart below, we illustrate the percentile rank in dispersion of returns across various global indices and include rankings from a year ago for comparison. In general, the return dispersion for major indices is well below historical medians and is in the bottom quintile for most of them.
Dispersion of Returns – Globally, Equity Indices Rank Low
[caption id=”attachment_266918″ align=”alignnone” width=”1174″]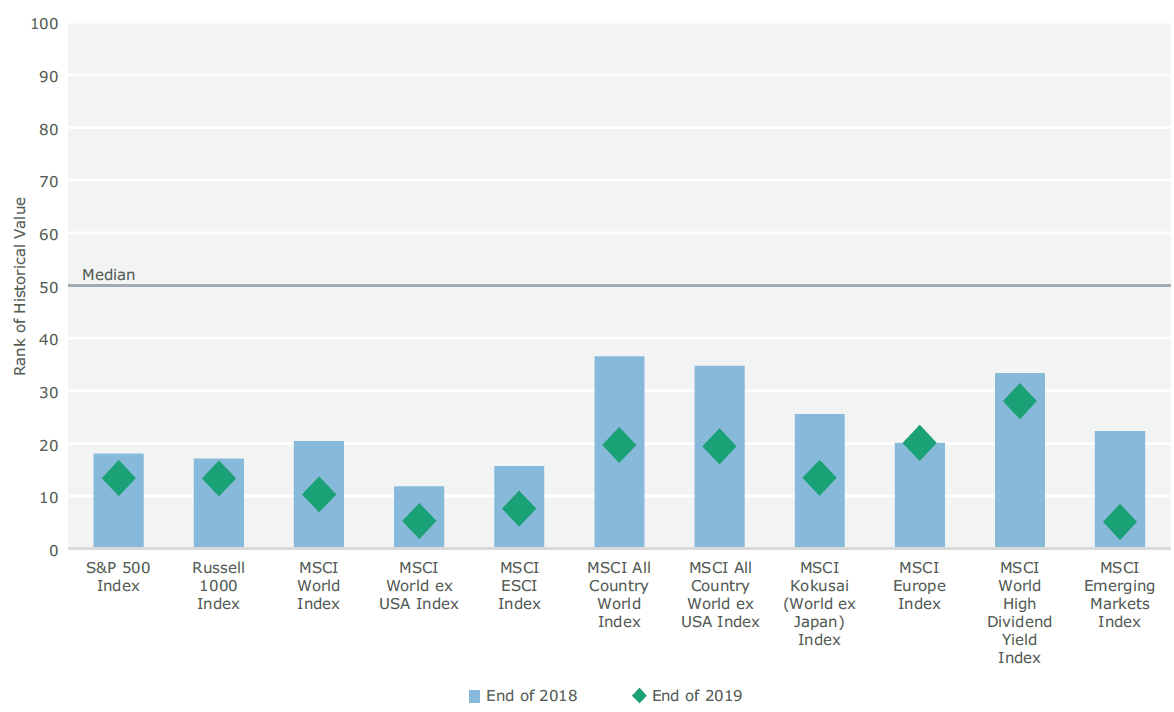 Source: Intech. Data reflects past performance, which does not guarantee future results.[/caption]
Consequence of Convergence
Lower dispersion is typically an indication that overall market sentiment – rather than individual company results – is driving stocks’ returns. It indicates that, despite the euphoria across a broad market segment, the largest and most sophisticated investors are reluctant to make large trades and build large positions, likely because they’re anxious and waiting for the other shoe to drop. The higher the anxiety among these large investors, the more magnified the overall market’s eventual response to either positive or negative news.
Here’s how it potentially unfolds: Unexpected events, which investors might normally take in stride, increasingly cause some investors to take positions away from consensus in an attempt to anticipate market direction. Investors who are committed to consensus may wait, but their anxiety grows, as in a game of musical chairs. As consensus thins, it releases pent-up, unrealized drift between stocks, which dramatically magnifies risk exposures faster than most investors can manage their exposure to them.
It’s telling that the last time we saw such low levels of return dispersion like we’ve experienced from late 2015 through present day was between 2005 and 2007 (see chart below). In such a strained regime, it is important for investors to carefully evaluate risk and dynamically adapt their portfolios to rapidly changing market conditions.
Historical Dispersion of Returns
[caption id=”attachment_266929″ align=”alignnone” width=”1187″]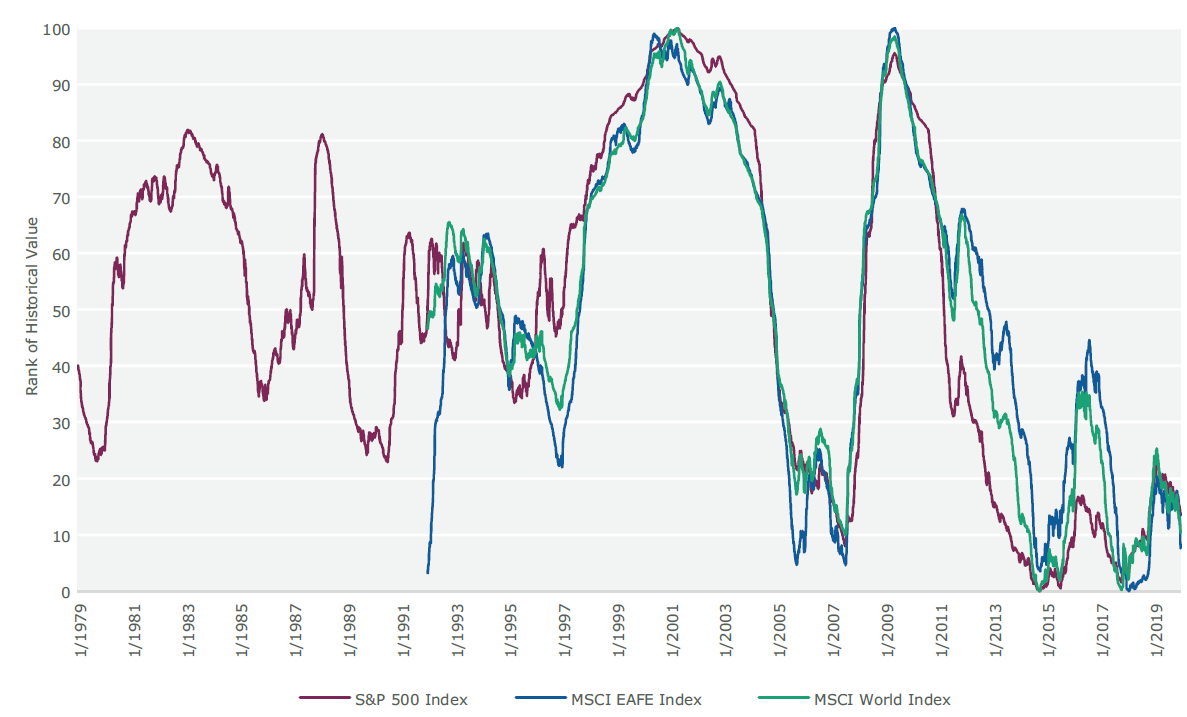 Source: Intech. Data reflects past performance, which does not guarantee future results.[/caption]
But Wait, There’s More
Dispersion describes the absolute magnitude of relative stock price movements, while correlation measures the relative alignment between their movements. Today, while we’re observing persistently low dispersion across global equity markets, we’re also seeing a dramatic increase in correlations across these same markets, as illustrated in the figure below. In other words, not only are the stocks’ relative returns converging, but they are also moving in tandem.
Equity Correlations Have Increased
[caption id=”attachment_266940″ align=”alignnone” width=”1169″]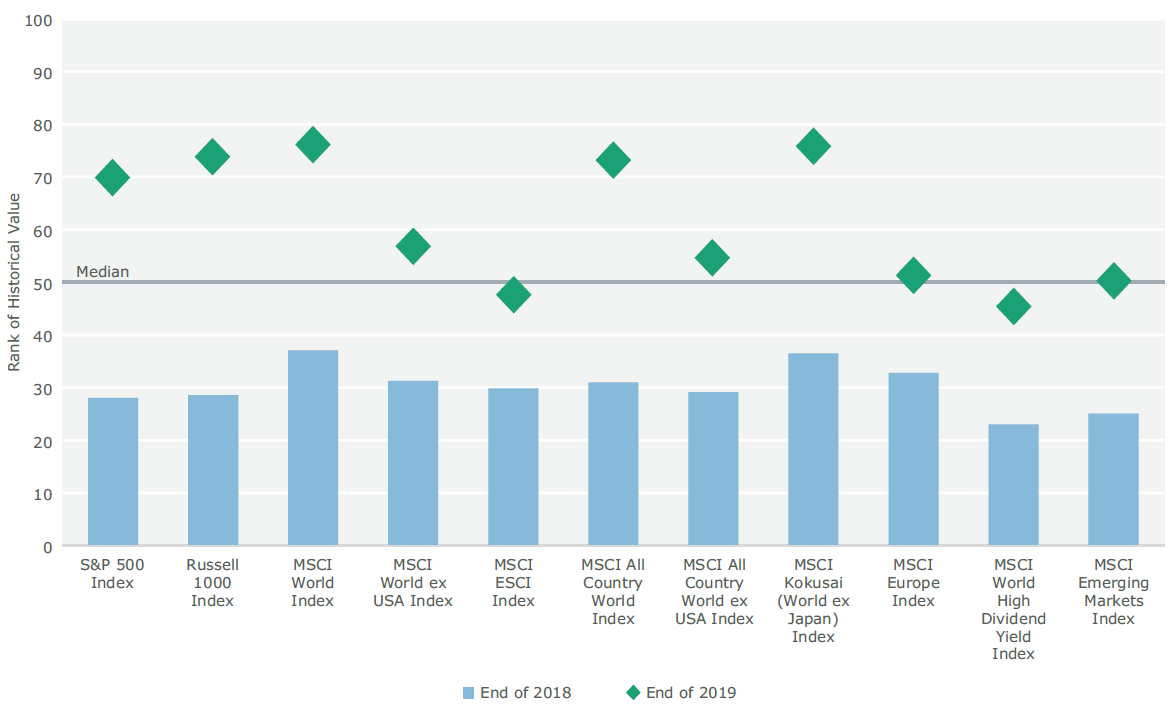 Source: Intech. Data reflects past performance, which does not guarantee future results.[/caption]
The market levels of dispersion and correlations are powerful leading indicators: They belong to a class of equity market metrics that are reliably stable over the long term. When these measures depart from their typical values, they indicate a sign of strain in the market. Historically, such high correlation – especially when combined with low dispersion – has been useful in identifying the high likelihood for black swans, such as the periods in the mid-1990s and the beginning of 2007, which preceded major market disruptions.
Of course, these metrics do not represent a guarantee of market dislocation, especially in the near term. But just as Wile E. Coyote won’t start falling until he’s realized he’s stepped over the cliff’s edge, the market can pursue bubble dynamics for a while. And the longer and further dispersion and correlations deviate from equilibrium, the more potential energy is stored in the market, and the more painful the eventual snap will likely be.
What Are the Implications for Investors?
The potential risks due to the high levels of strain indicated by the low return dispersion and high correlations require investors’ full attention on equities, which, even in normal market conditions, constitute the largest source of risk in a typical portfolio. Regardless of asset allocation, a more defensive mindset is prudent.
It’s perfectly reasonable to accept underperformance in the short term, due to certain risk exposures, but it’s also vital to understand thoroughly these drivers of risk and the potential downside they create.
Today’s environment is also a call to uncover higher levels of portfolio efficiency by assembling a stable of active strategies that complement traditional active and passive allocations.
Conclusion
Market efficiency makes global strategy outlooks and other directional forecasts difficult to use; instead, we recommend taking a more integrated view of the equity market based on stock interactions. We believe this approach is more reliable for identifying market strain and navigating market dislocations.
If history is a guide, the current environment is not likely to sustain itself. Investors should prepare themselves for market shifts by reviewing their exposure to risk and considering complementary equity exposures to help diversify their portfolios. We believe these are important first steps in establishing a more defensive posture for tomorrow’s equity markets.
Knowledge. Shared
Blog
Back to all Blog Posts
Subscribe for relevant insights delivered straight to your inbox
I want to subscribe