Subscribe
Sign up for timely perspectives delivered to your inbox.

The long-standing view here has been that global economic momentum would bottom around Q3 2019 but remain weak into H1 2020. December flash PMIs support the scenario: manufacturing PMIs, in particular, were disappointing, falling in all six countries for which flash data are released, although readings remained above recent lows in all but the UK and Australia.
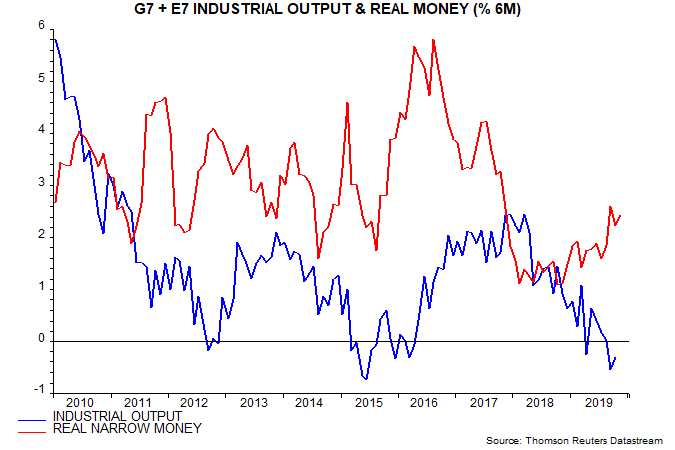
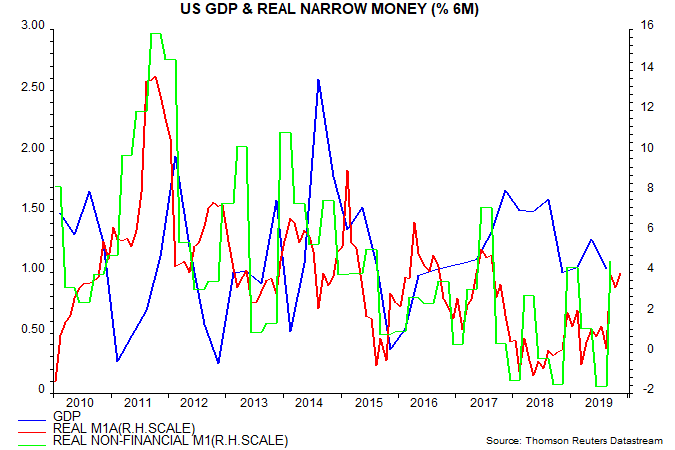
Global narrow money trends, meanwhile, continue to cast doubt on hopes of a solid, synchronised economic recovery in 2020. Six-month growth of G7 plus E7 real narrow money is estimated to have edged up to 2.4% in November but remains below a post-GFC average of 3.2% (i.e. calculated over 2010-18). Real money growth rose above 4% ahead of economic pick-ups in 2012-13 and 2016-17 – see first chart.
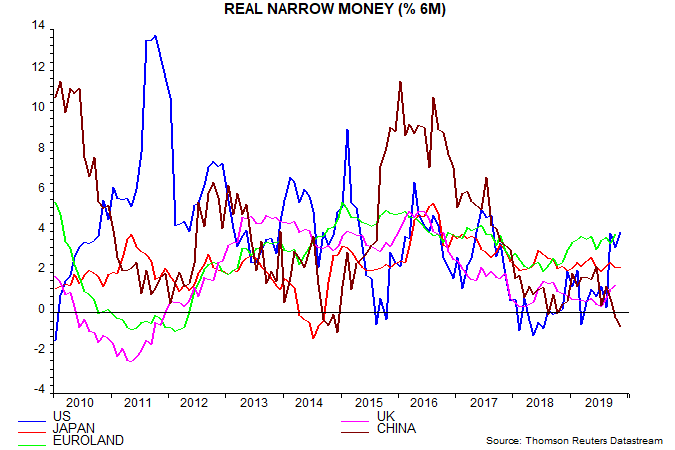
Subdued G7 plus E7 real narrow money growth conceals a strong pick-up in the US since August offset by a deepening contraction in China – second chart. The latter development reflects a slowdown in nominal money growth coupled with a food-driven inflation surge and suggests that economic news will surprise negatively in early 2020 – see previous post.
The acceleration in monthly US narrow money numbers has been confirmed by the quarterly non-financial M1 measure, which performs slightly better as a leading indicator but is less timely – end-September data became available last week with publication of the Fed’s Q3 financial accounts. Allowing for a typical nine-month lead, the suggestion is that the US economy will regain momentum around mid-2020 after a weak start to the year.
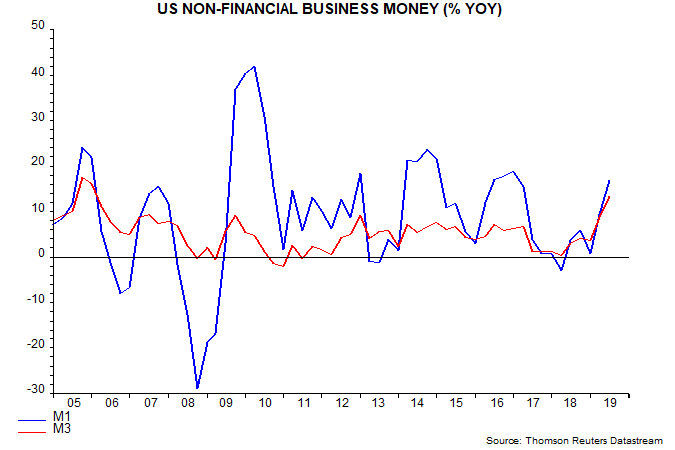
The US pick-up has been driven by business money holdings, consistent with the expectation here that both the stockbuilding and business investment cycles will have entered recovery phases by mid-2020.
The suggestion from the monetary data of US relative economic strength later in 2020 raises the possibility of the Fed shifting back to a tightening bias in H2 before recoveries have been established in China and Europe – a potentially negative scenario for markets.
The MSCI All-Country World Index recently surpassed its January 2018 high in US dollar terms but is still down by about 4% relative to 10-year US Treasuries, indicating that markets are not yet fully convinced about an economic recovery – fifth chart.
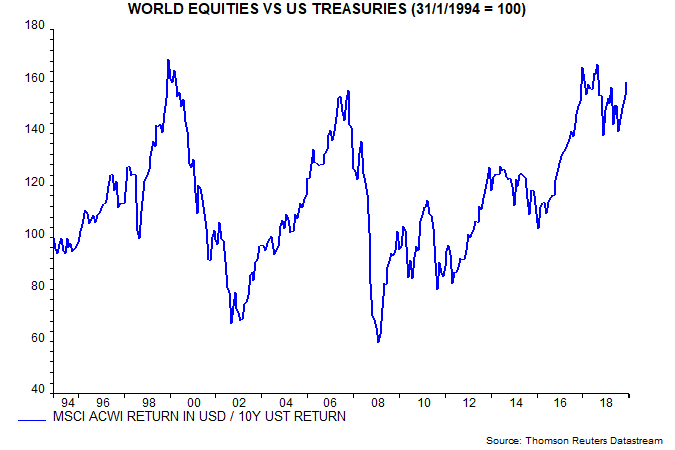
Bullish commentators draw a parallel with 2011-12 and 2014-16, arguing that the relative return ratio will break out soon as recovery hopes are confirmed. As noted earlier, however, narrow money trends are significantly weaker now – the ratio could test the downside again first.
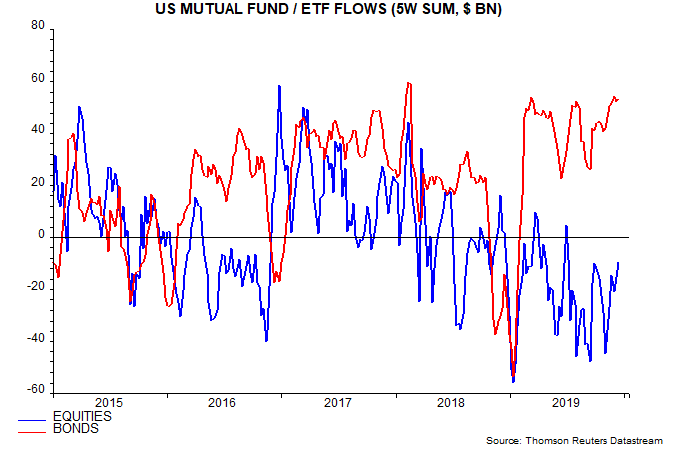
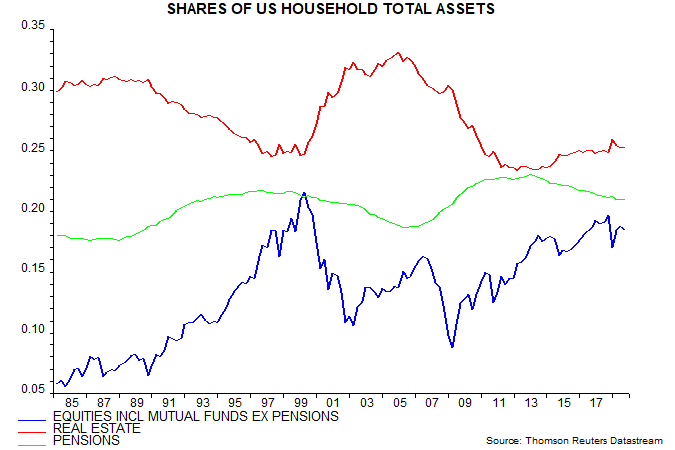
Bulls also cite recent record outflows from US equity mutual funds and ETFs, arguing that retail investors will be forced to chase the current rally – sixth chart. The Fed’s financial accounts, however, show that the equity share of US household wealth is high by historical standards, questioning the necessity of buying – seventh chart.