Knowledge. Shared Blog
December 2019
Market GPS: The Outlook for Global Property Equities
-
 Tim Gibson
Co-Head of Global Property Equities | Portfolio Manager -
 Guy Barnard, CFA
Co-Head of Global Property Equities | Portfolio Manager
Guy Barnard and Tim Gibson, Co-Heads of the Global Property Equities Team, review the sector’s performance over the year and discuss the key opportunities and risks for investors in 2020.
Key Takeaways
- While listed property equities have performed well this year, returns have varied across cities, countries and sectors, highlighting the need for an active investment approach.
- Looking forward, we believe the biggest risk to property equities is likely to be a pickup in growth and inflation expectations.
- We remain positive on sectors we think are benefiting from technological and demographic tailwinds such as data centers, cell towers, manufactured housing and student accommodation.
Global property equities have delivered strong returns in 2019. Overall, the sector has kept pace with wider equity markets in the last two years (see Exhibit 1) while also providing a “smoother ride” for investors, with the sector seeing relatively lower drawdowns.1
Averages can be misleading, however, and within the sector we have seen high levels of dispersion, reflecting the differing real estate market fundamentals across different cities, countries and – most importantly – sectors. For example, U.S. manufactured housing REITs have gained more than 50% this year, whereas U.S. shopping mall REITs are down 17%.2 We expect this trend to continue in 2020, albeit the spread of returns may narrow somewhat.
Exhibit 1: Relative Performance: Global Property Equities vs. General Equities Since 2018
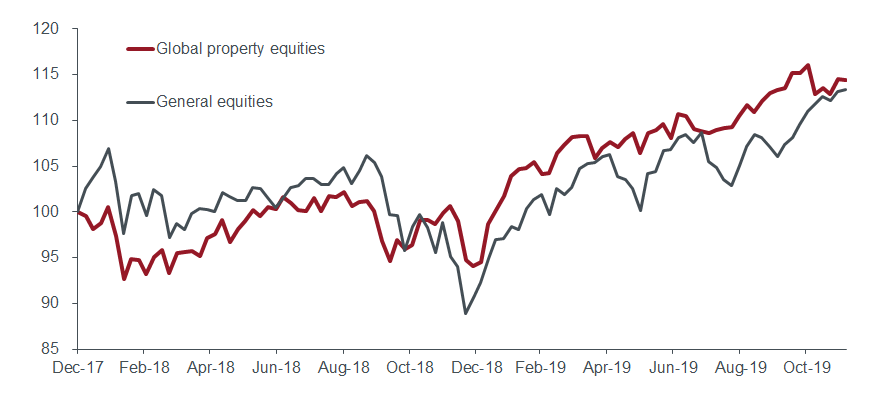 Source: Bloomberg, Janus Henderson Investors. Global property equities (FTSE EPRA/Nareit Developed Total Return USD Index) versus general equities (MSCI AC World Total Return Index) weekly data to 12/6/19, indexed to 100 as of 12/29/17. Past performance is not a guide to future performance.
Is the Sector Expensive Now?
Despite gains of around 20% year to date, annualized returns of 8% and 6% over the last three and five years, respectively, (more than half of which have come from dividends)3 look fair to us.
In terms of valuations, the discount to net asset value (NAV) for public real estate markets has narrowed over the year (see Exhibit 2) and now looks to be largely in line with private markets. This is broadly in the middle of what we consider to be the “fair value” range and suggests that returns from here will come from income and growth rather than repricing.
Exhibit 2: Global Property Companies Have Been Trading at Discounts to NAV in Recent Years
[caption id=”attachment_260296″ align=”alignnone” width=”911″]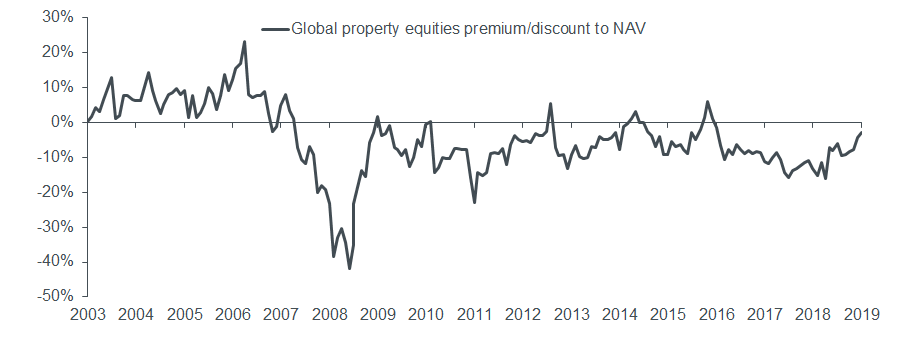 Source: UBS, Janus Henderson Investors. FTSE EPRA/Nareit Developed Total Return Index, monthly data from September 2003 through September 2019. Past performance is not a guide to future performance.[/caption]
If we focus on earnings multiples in the U.S., even after U.S. REITs have returned more than 25% year to date,4 the multiple is still lower than that of the S&P 500® Index today and back to a similar level as the U.S. REIT index was five years ago (see Exhibit 3).
Exhibit 3: REITs Appear to Be Fairly Valued vs. General Equities
[caption id=”attachment_260307″ align=”alignnone” width=”725″]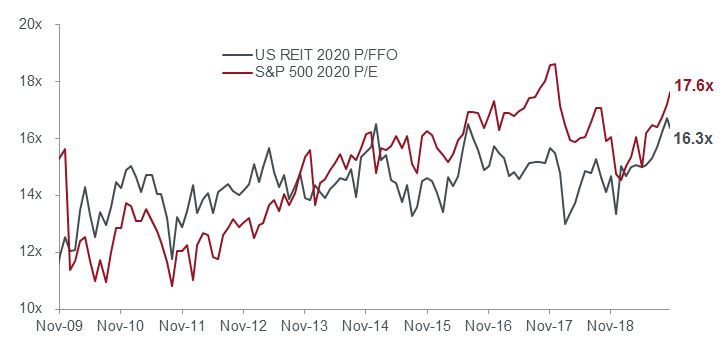 Source: Capital One Research as of 11/15/19. P/FFO (price-to-fund from operations) is similar to the P/E (price-to-earnings ratio) commonly used to value a stock. P/FFO provides a more accurate valuation of real estate stocks, taking into consideration noncash factors such as amortization and depreciation. Past performance is not a guide to future performance. [/caption]
A New Decade Brings New Opportunities
The real estate sector, like most others, is evolving. A series of powerful structural forces are shifting the landscape. The pressure on traditional retail properties serves as a stark reminder that no sector is immune to the changing tide. While we still find opportunities across all sectors, a healthy dose of reality is required when projecting future returns in sectors that are facing headwinds, such as retail.
By contrast, we remain positive on sectors benefiting from technological and demographic tailwinds. While the industrial and logistics sectors have performed well, we believe that limited supply, coupled with substantial demand driven by the growth of e-commerce and retailers’ need to compete on services, is likely to continue to drive values higher. We also see ongoing opportunities in specialist sectors such as data centers, cell towers, gaming, manufactured housing and student accommodation.
Building Blocks
Finally, while we have no strong macro views, as we move into the later stages of the economic cycle, it is reasonable to assume that there will be periods of market volatility and drawdown. In this environment, REITs have been doing their job, offering low correlations to many other asset classes and a lower beta5 in an equity market context and typically holding up better in down markets in the last 10 years.
The biggest risk to property equities in the coming year may come from a pickup in growth and inflation expectations. Any short, sharp rise in bond yields and cyclical rotation would likely cause the sector to underperform.
In our view, with a balanced yet uncertain outlook, listed real estate has a role as a core “building block” within a diversified portfolio, where it has the potential to reduce risk and enhance returns. In this way, the sector may help those of us without perfect 20/20 vision to navigate through the year ahead and beyond.
Which market trends should investors
watch in the year ahead?
Explore Market GPS: Investment Outlook 2020
1Bloomberg as of 9/30/19. Sector refers to FTSE EPRA/Nareit Developed Total Return Index.
2Bloomberg U.S. Real Estate Index by grouping as of 12/12/19. BBG U.S. REITs Index is a capitalization-weighted index of Real Estate Investment Trusts having a market capitalization of $15 million or greater.
3Morningstar. FTSE EPRA/Nareit Developed Total Return USD Index returns to 11/30/19.
4FTSE Nareit All Equity REITs Index year-to-date returns to 11/30/19. The FTSE Nareit All Equity REITs Index is a free-float adjusted, market capitalization-weighted index of U.S. equity REITs. Constituents of the index include all tax-qualified REITs with more than 50 percent of total assets in qualifying real estate assets other than mortgages secured by real property.
5Sources: European Public Real Estate Association (EPRA) as of 9/30/19; low beta comparison FTSE EPRA/Nareit Developed Total Return Index versus MSCI World Index.
Knowledge. Shared
Blog
Back to all Blog Posts
Subscribe for relevant insights delivered straight to your inbox
I want to subscribe