Subscribe
Sign up for timely perspectives delivered to your inbox.

In an aging economic cycle, we believe equities currently look attractive relative to bonds. Risks are present, however, and we believe a focus on quality is crucial for investors.
The general belief is that we are nearing the end of an economic expansion that has lasted over a decade. With this view comes the inevitable question of whether a recession is imminent or if we are merely entering a period of slower growth, leading investors to question what their next move should be. Can equities continue their ascent or are valuations now too stretched? Should investors adjust asset allocations to become more defensive?
At this point in the cycle, examining present and past valuations of equities and bonds may provide some guidance. Valuations are a constant balancing act of risk and return expectations and can be helpful in evaluating the tradeoffs between asset classes.
Currently, we believe that equities are more favorably valued than bonds. In our opinion, low interest rates continue to support a positive risk/return profile for equities, which we believe are still at reasonable valuations with room for further growth.
One way to evaluate asset allocation decisions is to look at the relative attractiveness of valuations. The chart below shows a classic comparison of U.S. bond and stock market yields: the 10-year Treasury yield divided by the earnings yield of the S&P 500® Index.
[caption id=”attachment_254076″ align=”alignnone” width=”599″]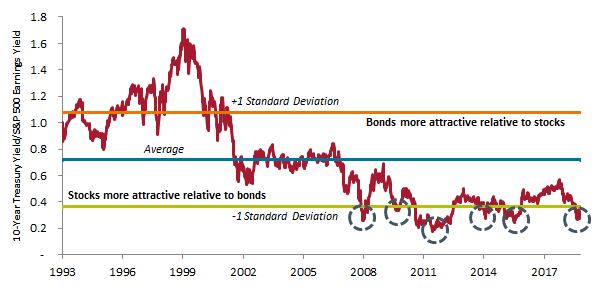 Source: Bloomberg. Data: 12/31/93 through 11/1/19.[/caption]
Typically, the 10-Year Treasury yield is lower than the earnings yield of the S&P 500 Index, as Treasuries tend to carry less risk than stocks. Therefore, we would expect the ratio of the 10-year/S&P 500 on the graph above to be below 1.0 consistently, which in recent decades has generally been the case. In fact, over nearly 30 years, the average ratio has been about 0.7, with the 10-year Treasury average yield at 4.1% and the S&P 500 average earnings yield at 6.0%, a difference of 1.9%1.
When the ratio rises or falls significantly above or below the average relationship (we have noted one standard deviation above (orange) and below (green)), it could be a sign of significant over- or undervaluation. Since the current bull market began in March 2009, the ratio has regularly dropped by more than one standard deviation below the average, with the 10-year Treasury yielding 2.5% on average and the S&P 500 earnings yield averaging 6.4%, a difference of 3.9%1.
Conversely, during the tech bubble of the late 1990s and early 2000s, the 10-year yield was considerably higher than the S&P 500 earnings yield1. Stock prices became extremely expensive, driving the earnings yield down, while the yield on the 10-year Treasury was considerably more attractive. Following these extreme valuations, the stock market experienced a significant correction.
Another way to look at valuations is through the ratio of price to yield for both the 10-year and the S&P 500. The price/yield ratio can give us a sense of how expensive each asset class is relative to its yield and also put that valuation into historical context. While the price/earnings yield on the S&P 500 has generally fluctuated around its average (except in the late 1990s and early 2000s when multiples soared), since 2009 the price/yield for the 10-year Treasury has risen above its average and has remained persistently elevated. In fact, at times the 10-year has traded nearly 2.5x its long-term average of 29.5 over this 10-year period1. While equity valuations have also climbed at points, Treasuries have appeared particularly expensive. The S&P 500 currently is trading at what we believe to be a reasonable valuation and within historical ranges.
[caption id=”attachment_254087″ align=”alignnone” width=”657″]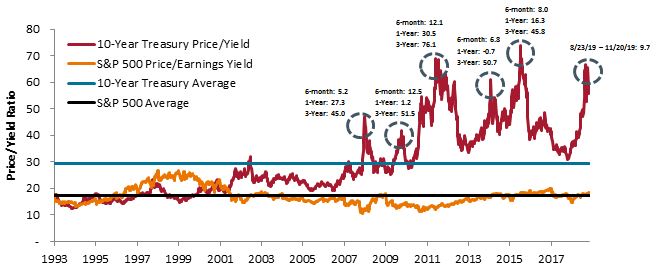 Source: Bloomberg. Data: 12/31/93 through 11/1/19.[/caption]
When Treasury yields fall (and bond prices climb), it can be due to a flight to quality amid market fear, as investors are willing to pay a premium for the relative safety of government-backed Treasuries. A flight to quality often corresponds with a drop in stocks. When you look at spikes in the prices of the 10-year highlighted above, they parallel the points on the first chart when the yield ratio has been more than one standard deviation below its average (i.e., when stocks are significantly more attractive than bonds). This has happened several times over the past decade, most recently in August 2019. The table below shows the six-month, one-year and three-year returns for the S&P 500 following the peaks of these spikes. During the current bull market, when demand for the 10-year Treasury has spiked in these instances, the stock market has generally continued to move higher in subsequent periods.
[caption id=”attachment_254042″ align=”alignnone” width=”370″]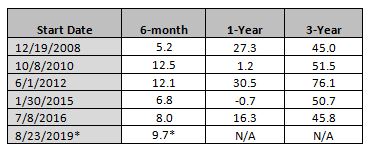 *Return is for 8/23/19-11/20/19. Source: Bloomberg.[/caption]
While past performance cannot be relied upon for future results; typically, when relative valuations have been at similar levels as they are now, equities have gone on to deliver positive returns. Valuations at these levels may be an opportunity for investors to evaluate asset allocations, taking into account their risk-tolerance, time horizon and other important factors. We consider the opportunity in equities now to be more attractive than that in bonds for those with the appropriate risk-tolerance.
Late in the business cycle, however, we believe a focus on quality and downside protection is also important. On an absolute basis, stocks are not cheap, and there are distinct risks in the market around global trade, the 2020 presidential election and slowing economic growth. However, with a focus on long-term secular themes and quality firms, we believe opportunities can be found through a variety of market cycles and economic conditions.
We define quality firms as those showing revenue and earnings growth and increasing dividends, as well as those potentially benefiting from secular growth tailwinds. These companies tend to be differentiated from their peers and have a history of financial stability, high free cash flow and intelligent capital allocation that should drive shareholder value over time. A low-rate environment should continue to be supportive of companies investing for expansion and growing market share.
While we cannot predict how long the equity bull market will last, we believe there remains more opportunity than risk in high-quality equities at this time.
Note: 1. Source: Bloomberg, 1 November 2019.
10-Year Treasury Yield is the interest rate on U.S. Treasury bonds that will mature 10 years from the date of purchase.
S&P 500® Index reflects U.S. large-cap equity performance and represents broad U.S. equity market performance.
Standard Deviation measures historical volatility. Higher standard deviation implies greater volatility.