Subscribe
Sign up for timely perspectives delivered to your inbox.

“May the odds be ever in your favor”
– Effie Trinket, The Hunger Games [2012]
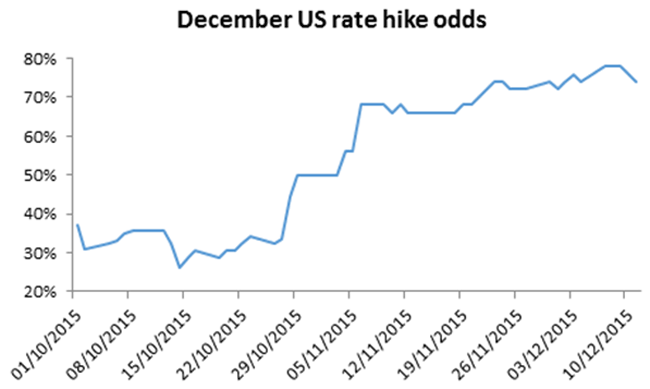
A favored sitcom trope is to drag out a predictable romantic pairing until most viewers have long stopped caring. Depending on how old you are, this is the last Sam & Diane (Cheers), Ross & Rachel (Friends), Tim & Dawn (The Office UK), or Ted & Robin (How I Met Your Mother) moment arriving well past their due dates. The Fed screenwriters have similarly painted themselves into a corner, with a bored market wanting them to “just hike already”.

Source: Bloomberg
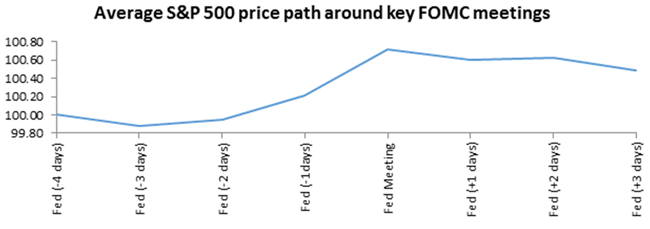
Stocks have reflected some concern with the S&P 500 falling 4% last week, but looking at just the days immediately around important FOMC meetings (those with press conferences, as this week’s has), the odds of a bounce are historically high. The win rate from buying two days prior and selling at the close post-meeting has been about 90% with an average 2-day return of 0.76%.
 Sources: Federal Reserve, Bloomberg.
However, none of those meetings involved a rate hike. A number of research firms are trying to bridge this gap by publishing thick “how-to” guides to navigating rising rates. Their methodologies are broadly similar – crunch average asset class returns over the last half-dozen US cycles. The general conclusion is that odds favor stocks to outperform and bonds to suffer over the 6-12 months that follow the first Fed tightening.
These models predict the future by averaging the past. But prior US cycles were quite disparate – short-term rates at the start of the 1986-1989 tightening cycle were 5.875%, above the end point of the most recent 2004-2006 cycle which peaked at a 5.25% base rate. Demographics, technology and debt outstanding have all changed dramatically since. The US government currently spends 13% of federal revenue to service outstanding debt despite paying just 2.2% interest on average, or about one-quarter of its 9% borrowing cost in 1986.
So rather than just reaching back decades, we should also reach across borders to evaluate more recent rate cycles in Japan. This may seem oxymoronic, given the popular narrative that Japanese rates went to zero and have never budged since. What gets forgotten is the Bank of Japan (BoJ) raised rates in August 2000 by 0.25% before reversing course seven months later. And Japan tried this great escape again in 2006-2007 with two successive hikes that lasted over a year until the bankruptcy of Lehman Brothers forced a rapid climb down.
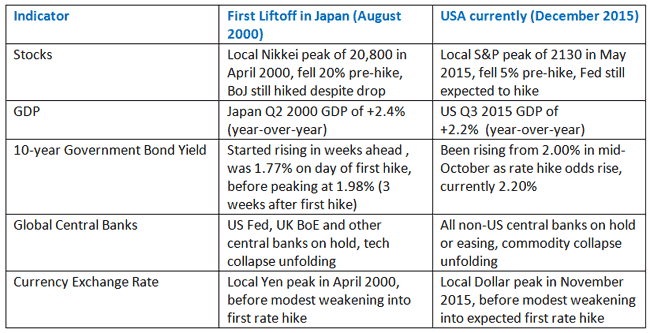
Interestingly, there are several similarities between the first liftoff in Japan and the US today.

Source: Bank of Japan, Bloomberg
The outcome of this first Japanese rate hike was diametrically opposite from the average US experience. The Nikkei dropped a further 20% between August 2000 and February 2001 significantly underperforming other markets. Japanese government bonds surged with the 10-year yield falling below 1.4%. Inflation collapsed with core Japanese CPI falling to -1.0% in February 2001 which eventually forced the Bank of Japan to reduce rates back to 0% through back-to-back cuts in March and April 2001.
Five years later, Japan had regained momentum with first-quarter 2006 GDP reaching 2.6%, the Nikkei doubling from its 2003 trough, and Japanese 10-year bond yields once again approaching 2%. The Nikkei hit a local peak of 17,500 in April 2006 before quickly falling 15% over the next three months. Nevertheless, in July 2006, the BoJ raised rates by 0.25%. This time the stock reaction was more favorable with the Nikkei rising 20% over the next six months, although the index only modestly exceeded its pre-hike peak. But the bond market never shared this optimism and 10-year yields fell to 1.6% even as stocks rallied.
The BoJ still proceeded with a second 0.25% hike in February 2007. This proved to be the straw that broke the camel’s back with the Nikkei losing 10% over the subsequent six months and underperforming the S&P 500 significantly. Over the next year (2008), the Nikkei continued to plummet while Japanese bonds rallied as the global financial crisis intensified. After Lehman failed, the BoJ made back-to-back cuts in October and December 2008, and the resultant base rate of 0.1% has persisted until today.
Japan made two attempts to “normalize” rates but neither stuck, and instead these turned out to be excellent entry points to buy government bonds. And looking out 6-12 months, the hikes didn’t turn out well for stocks either. The limitations of the above analysis are obvious – generalizing from two examples and the US is clearly not Japan. But similarly, most analysis of prior US rate cycles look at just six examples, and implicitly assume that the US today is comparable to thirty years ago.
Most professional football teams have long histories, yet no one would calculate this weekend’s odds by merely averaging decades of prior games. The past is prologue but the future is not a replica of the past.
C-3PO: “But sir, the possibility of successfully navigating an asteroid field is approximately 3,720 to one”
Hans Solo: “Never tell me the odds”Star Wars: Episode V – The Empire Strikes Back [1980]