Subscribe
Sign up for timely perspectives delivered to your inbox.

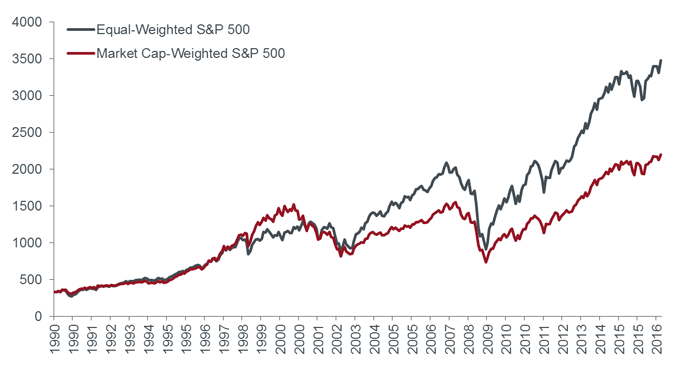
The importance of diversification has been recognized for thousands of years – the Talmud written around 200 B.C. advised putting one-third of assets in land, one-third in business, and keeping one-third in reserves. We all know that diversifying mitigates idiosyncratic risk and reduces portfolio volatility. Despite all the advances in portfolio optimization theory, dividing evenly across asset classes or securities has an excellent track record. The modern incarnation of this very old approach is classified as a kind of “smart beta” – using an equal or capped-weight index rather than the market-cap version. The chart below compares the equal-weighted S&P 500 versus the market cap-weighted S&P 500 over the last 25 years.
Source: Bloomberg, S&P, as of November 30, 2016
Although the equal-weighted version has trounced the traditional index over time, it notably underperformed during the late 90’s tech bubble. The surge in the technology sector drove the S&P 500 index to become concentrated in high P/E names due to the sharp rise in their market capitalization. Conversely, the more diversified equal-weighted index has an inherent value bias by avoiding overweighting unusually large or extreme valued companies.
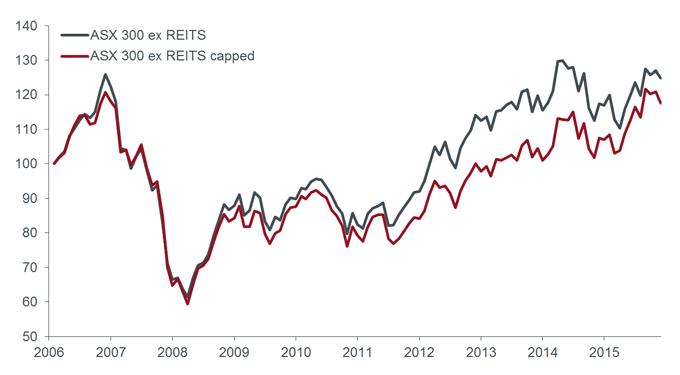
But this approach has not worked everywhere. Notably, in Australia, a capped version of the ASX 300 index has underperformed market-cap weights over the last 10 years. This is likely analogous to the US tech bubble experience, as Australian indices have grown increasingly concentrated in the financial sector.
Source: Henderson Global Investors, S&P/ASX, as of November 30, 2016. Index returns rebased to 100.
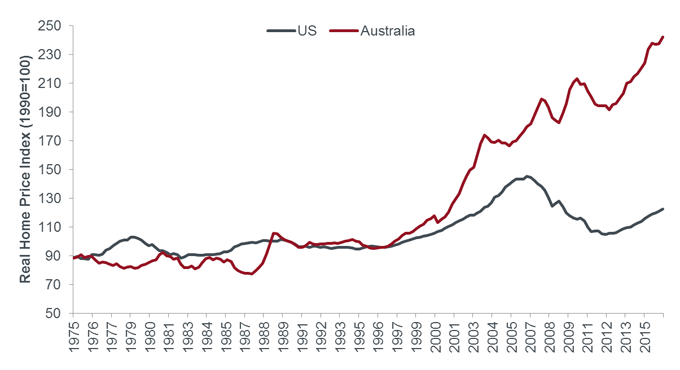
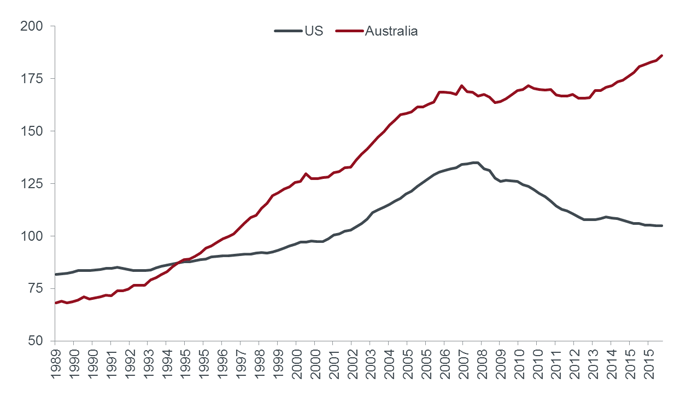
The surge in financial capitalization is directly related to Australian real estate. Rather than subject you to words, here are two charts that tell you everything you need to know: the first shows Australian home prices, while the second shows the debt incurred to pay for them.
Source: Minack Advisors, as of November 30, 2016
Source: Minack Advisors, as of November 30, 2016
Bubbles are hard to identify, but even more challenging is timing the eventual bust. People that got the “Big Short” right and correctly wagered against US housing won fame, fortune and eventually a movie. A key aspect, notably explained by Margot Robbie in a bubble bath, was the ability to short low-quality housing bonds for as little as 1% per year, allowing funds to wait years for the collapse to play out.
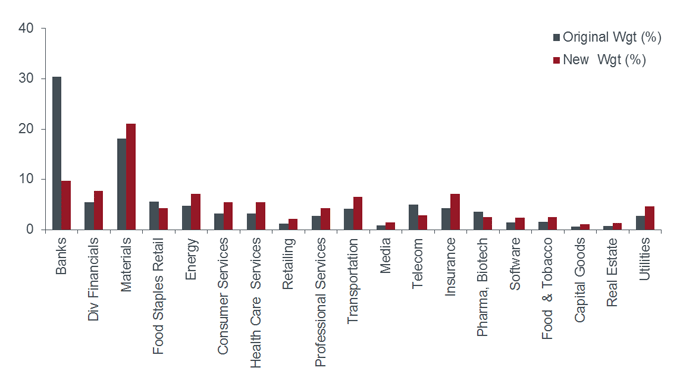
However, in Australia there are no cheap bonds to short, so hedge funds have turned to betting against the largest bank stocks instead. In any country, bank equity is vulnerable given their inherent leverage and mismatch between short-term funding and long-term loans. Looking at the US collapse, banking shares dropped more than 80%, while non-financials fell 40%, and a similar dispersion have been evident in Europe and elsewhere. Notably, Australian financials now make up nearly 40% of the ASX 200, with banks alone accounting for about 30% while technology only has a 1% weight. A banking crisis would have an out-sized negative effect on any Australian market cap-weighted index.
However the cost to maintain this short position is considerable – the “Big Four” Australian banks yield an average 8% gross dividend. There is also no clear catalyst yet – although there is some evidence of lax lending and a slowdown in Chinese inflows. A rise in mortgage delinquencies, which signalled the impending US bust, hasn’t occurred to date. Australian economic data has also remained surprisingly robust despite weakness in commodities.
So rather than an outright banking short, a strategy that owns the entire ASX 200 index with a 2% position size cap cuts exposure to banks from 30% to 10% (see chart below). Notably, despite the extraordinary finance and real estate boom, this capped version has underperformed the overall index by less than 1% per year.
But looking forward, even if Australian housing plateaus, it seems unlikely that Australian financials will further increase their already approximately 40% share of market capitalization, so non-financials should keep pace with the broader market. Meanwhile in a bust scenario, the capped version could potentially outperform the uncapped index by 10% or more – a huge difference.
| Original Index | Capped Index | |
|---|---|---|
| Dividend yield | 4.4% | 3.9% |
| Volatility | 14.6% | 14.1% |
Adding capping is not necessarily an argument for or against factor timing. Rather the US tech bust showed that having 45% of your portfolio invested in a single industry is a reckless risk, which can be significantly mitigated through diversification.
If you think an Australian bust is nigh, then you could either zero-weight or short the “Big Four” banks if your mandate allows you to. But for long-only investors, reweighting the index to deemphasize financials is a logical first step while watching for clear signs of a housing slowdown. Although this approach would have underperformed the index modestly, investing this way makes a lot of sense when thinking about the biggest future risks Australian markets face.
It is easy to be swayed by historical comparisons in Australia or any other single country into choosing a more concentrated market cap-weighted index. But the global experience over the long-run shows that building a more diversified portfolio drives higher returns, lower risk, and greater resilience to shocks.