Subscribe
Sign up for timely perspectives delivered to your inbox.

Portfolio Manager Kevin Preloger discusses the implications for value investing in a market receiving mixed signals.
It is no secret that growth stocks have enjoyed persistent momentum during the bull market and that multiples have been bid up well above those of value stocks. Chart 1 below shows growth versus value index performance over the last 12 years, with growth holding a significant edge, as well as the current price-to-earnings (P/E) ratios for the same indices, which show value as significantly less expensive.
 Source: Bloomberg, 3 January 2007 – 4 October 2019, rebased to 100 on 3 January 2007.
In September, we saw a swing in leadership from growth to value, signalling to some a possible sea change in the market. Much was made of this rapid shift from growth to value. But the market is receiving mixed signals as central banks – that appear willing to do anything despite depleted monetary policy tools – adopt aggressive monetary easing policies to counteract weaker economic data. While some value sectors have shown near-term strength, we believe there is a clear division between high quality and low quality opportunities.
Much of what is on offer in terms of value are financials, energy and consumer discretionary stocks. We have believed that financials are attractively valued for some time, with banks and insurance companies particularly appealing in the current environment. In our opinion, banks are capital rich and operating in a benign credit environment. However, we are acutely aware of the machinations of the yield curve. For a bank’s core lending activity to work effectively, the yield curve needs to be an upward sloping line, not its current ‘pancake’ form. That is, for banks to make money lending, they need to borrow at lower rates on the short end of the curve and lend at higher rates on the longer end, earning a profit on the spread (the difference between the two rates).
Typically, long-term rates are higher than short-term, but lately the curve has ‘flattened’ and even ‘inverted’, whereby long-term rates are lower than short-term ones. Chart 2 below shows the current inverted US Treasury yield curve versus a more typically sloped curve from one year ago (October 2018). This is a development to monitor for its impact on banking and as the Federal Reserve considers a continued shift to more accommodative monetary policy.
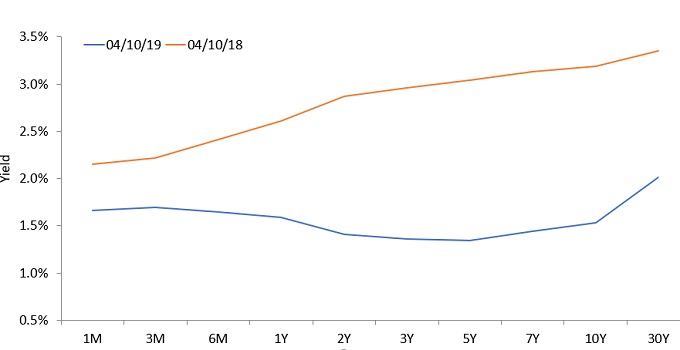
Source: Bloomberg. Yields on 1- to 10-year US government bonds have fallen below yields for very short-dated (1- to 3-month) government bonds. Changes in the yield curve can help to signal market expectations about a country’s economic direction.
We also see opportunity in insurance companies as pricing continues to increase, positively impacting earnings outlooks. In addition, as interest rates move lower, the book value of insurers’ investment portfolios typically moves higher.
Outside of financials, the other value sectors mentioned appear more challenged from a quality standpoint. In the energy sector, companies’ general lack of capital discipline and the capital markets’ willingness to ‘supply the juice’ (cheaply, we might add) to fund overly aggressive exploration and production projects are real dangers. This has left the balance sheets of many energy companies in a ‘no-go zone’. In addition, the recent attacks on oil infrastructure in Saudi Arabia caused crude prices to spike. The Brent crude oil price graph (Chart 3) shows the spike was brief and that prices quickly returned to levels lower than before the attacks, due to the abundant supply produced outside the Middle East. A broader slowdown in global economic growth could further weigh on oil prices going forward.

Source: Bloomberg, data as of 2 January 2019 – 4 October 2019
In the consumer discretionary sector, large-scale secular forces are at work. The impact of internet retail and the response of deeply entrenched players has made much of this sector unattractive in our view. Competitive moats that were once wide have dried up as internet-only retailers have flooded the marketplace and consumers have demanded next day shipping – for free. We believe many of these companies will continue to see relentless pressure on both top-line revenues and bottom-line earnings. Our consumer analyst frequently notes that the barriers to entry in retail are low, and the barriers to exit are high, making the competitive landscape particularly difficult to navigate. As a result, it is our view that the value names in retail appear inexpensive for good reason.
In September, the market saw value outperform growth. If a larger market rotation into value continues, we believe that investors must still be diligent in assessing that value. For instance, many of the companies currently on sale in the energy and consumer discretionary sectors appear low quality despite the fact that some have seen short-term strength.
Even more concerning to us though, is the downside risk in growth stocks, with the software industry as an example. We believe valuations are elevated, and multiple compression is a real possibility should earnings growth decelerate.
Within the current environment, it appears the market has begun to reassess the price levels of growth stocks and is weighing the potential for value stocks moving forward. Whether the leadership change from growth to value is short term or long lived, however, remains to be seen.
Growth and value investing each have their own unique risks and potential for rewards, and may not be suitable for all investors. Growth stocks are subject to increased risk of loss and price volatility and may not realise their perceived growth potential. Value stocks can continue to be undervalued by the market for long periods of time and may not appreciate to the extent expected.
Price-to-Earnings (P/E) Ratio measures share price compared to earnings per share for a stock or stocks in a portfolio.
S&P 400® Growth Index tracks the performance of US mid-cap equities with a growth tilt (measured by sales growth, the ratio of earnings change to price, and momentum). S&P 400® Value Index tracks the performance of US mid-cap equities with a value tilt (measured by the ratios of book value, earnings, and sales to price). S&P 500® Growth Index tracks the performance of US large-cap equities with a growth tilt (measured by sales growth, the ratio of earnings change to price, and momentum). S&P 500® Value Index tracks the performance of US large-cap equities with a value tilt (measured by the ratios of book value, earnings, and sales to price). S&P 600® Growth Index tracks the performance of US small-cap equities with a growth tilt (measured by sales growth, the ratio of earnings change to price, and momentum).S&P 600® Value Index tracks the performance of US small-cap equities with a value tilt (measured by the ratios of book value, earnings, and sales to price).
Janus Henderson and Perkins are trademarks of Janus Henderson Group plc or one of its subsidiaries. © Janus Henderson Group plc.