Subscribe
Sign up for timely perspectives delivered to your inbox.

Similar to recent months, signals emanating from our proprietary model based on options pricing continue to indicate looming weakness in equities and a still underappreciated upside to inflation. Geopolitical risks continue to dominate the headlines, with the ongoing trade saga and Brexit acting as potential headwinds for economic growth. But a risk flying under the radar is inflation. Options markets have been consistent in their view that inflation is a potentially brewing risk. Case in point are options signaling greater potential upside to commodities prices than down. Furthermore, excess reserves held at the Federal Reserve (Fed) continue to fall, which implicitly is increasing the circulation of money. This latter point deserves particular attention as once deployed into the economy, one dollar of excess reserves can be converted to multiple dollars of loans. Our concern is that this scenario could lead to a sudden increase in the velocity of money, and when combined with the current large supply of money, inflation could surprise us. We should be aware, as well, that the baseline effects of the drop in crude oil during fourth quarter of last year will phase out of subdued inflation measures shortly.
Using proprietary technology, Janus Henderson’s Adaptive Multi-Asset Solutions Team derives tail risk signals from options market prices on three broad asset classes. Given our current estimates of tail risks, we illustrate how those signals would impact a 60/30/10 allocation.

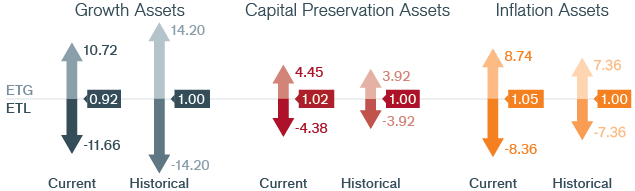
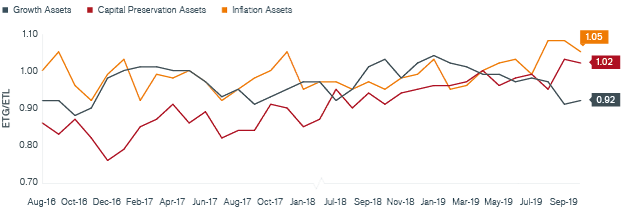
Our Adaptive Multi-Asset Solutions Team arrives at its monthly outlook using options market prices to infer expected tail gains (ETG) and expected tail losses (ETL) for each asset class. The ratio of these two (ETG/ETL) provides signals about the risk-adjusted attractiveness of each asset class. We view this ratio as a “Tail-Based Sharpe Ratio.” These tables summarize the current Tail-Based Sharpe Ratio of three broad asset classes.
This would not be a welcome surprise as the diversification benefits of a portfolio containing equities and bonds could be greatly diminished as both equities and fixed income would come under pressure simultaneously. Because of the significance of the risk posed by a surprise uptick in inflation, particularly at this stage of the monetary cycle, we will continue to pay special attention to price levels and share any important insights with the readers. With inflation still muted, the good news is the “doves” have the upper hand; the bad news is the “doves” may fuel the exact risk they hope to avoid by letting inflation loose. In addition to our outlook on broad asset classes, Janus Henderson’s Adaptive Multi-Asset Solutions Team relies on the options markets to provide insights into specific equity, fixed income, currency and commodity markets. The following developments have recently caught our attention:
Growth: Global equity attractiveness is below average levels. From a relative point of view, Japan is marginally more attractive relative to other developed markets.
Currency and Rates: Overall, duration remains attractive globally, yet much less attractive than a few months ago. Within currencies, the Japanese yen is showcasing strength – consistent with its reputation as a “risk off” trade.