Subscribe
Sign up for timely perspectives delivered to your inbox.

Ten years ago, the Kardashians came into our lives. No one could have predicted that documenting the daily life of an unknown family would be a breakout hit creating worldwide fame and fortune. Coincidentally (or not) the S&P 500 Index reached its pre-financial crisis high the very same week in October 2007 that the Kardashians debuted on TV.
The subsequent global market collapse was the exact opposite of triumph. Both the Kardashians’ success and the market’s failure were fat-tailed events well beyond normal expectations. Hollywood and Wall Street soon adapted to a new reality – anyone could become a star, and no asset was safe.
It is hard to infer expectations in entertainment, but option prices provide a measure for financial markets. If you expect a large move, but don’t want to bet on direction, you can purchase an at-the-money (ATM) straddle, which pays out the absolute value of the market move. Or if you want to protect your existing holdings, you buy a put option, which only pays off if the market drops, but costs roughly half of the straddle price.
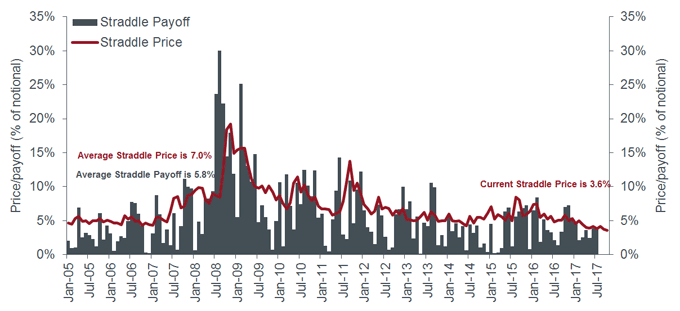
Buying options is mostly a losing strategy. Essentially you are buying insurance against a market move so the option price reflects the expected change + a profit margin. For the S&P 500, buying a three-month ATM straddle has cost 7.0% of the index price, on average, since 2005. The average actual three-month price move has been about 5.8% over the same period. So buying straddles would have caused an average quarterly loss of 1.2% + transaction costs over the last 12 years.
But as the Global Financial Crisis recedes from memory, the cost of buying these quarterly straddles has been steadily falling from a peak of 19% reached in 2008 to all-time lows. A three-month ATM straddle now costs just 3.6%. The chart below shows the price of a three-month straddle and subsequent payoff calculated monthly from January 2005 to October 2017.
Three month S&P 500 straddle price and payoff
This means the market expects the S&P 500 index to move less than 3.6% over the next three months in either direction. But looking at the history of the index, the actual average three-month change has been 5.8% since 2005, and 7.0% since 1928. Forget Kardashians and busts, this is forecasting that the range of future outcomes will instead be much smaller than in the past.
A counter-argument is that markets have been calm, and this can continue. Price volatility over the last three months has been 7% (annualised) – this is in the 3rd percentile of all these readings since 1928.
However, even from this low starting point, market expectations appear overly subdued. Looking only at those months in history when volatility readings over the prior three months were between 4% to 8%, the average subsequent three-month change was 4.3% i.e. still greater than the current straddle price.
This does not mean that the move over the next three months will definitely be over 3.6%. But selling straddles for 3.6% seems imprudent given the past evidence. Current pricing is at historically attractive levels to buy, not sell options.
The practical implication for investors is that the expected cost of using options is unusually cheap. Rather than buying or shorting stock to express a bullish or bearish view, the risk-reward of instead buying index call or put options appears currently quite favourable and limits downside risk to the premium paid.
Unexpected tail events can and will happen – the last decade of the Kardashians and boom-bust-boom is proof.