Subscribe
Sign up for timely perspectives delivered to your inbox.

Similar to last month, signals based on options market pricing continue to sound the alarm that we shouldn’t be so fast in writing off inflation risk. We see a greater risk of inflation moving higher than lower. While official price indices continue to show muted upside pressures, there are signs indicating that inflation could rise from its dormant state. Wages in the U.S. continue to grow at an annual pace in excess of 3%, domestic consumer spending is picking up, and home refinancing activity has sharply increased as mortgage rates are near all-time lows. This latest development has significantly improved the profile of the largest source of households’ debt burden. Furthermore – and perhaps under the radar – excess reserves held at the Federal Reserve continue to fall, which implicitly is increasing the circulation of money. This latter point deserves particular attention as one dollar of excess reserves can be converted to multiple dollars of loans. Our concern is that all of this could lead to a pickup in the velocity of money, and when combined with the current large supply of money, the roar of inflation would be heard far and wide.

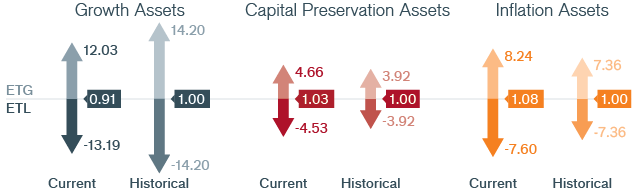
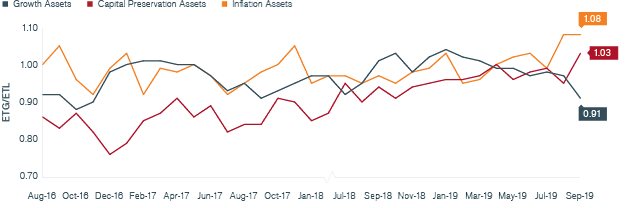
Our Adaptive Multi-Asset Solutions Team arrives at its monthly outlook using options market prices to infer expected tail gains (ETG) and expected tail losses (ETL) for each asset class. The ratio of these two (ETG/ETL) provides signals about the risk-adjusted attractiveness of each asset class. We view this ratio as a “Tail-Based Sharpe Ratio.” These tables summarize the current Tail-Based Sharpe Ratio of three broad asset classes.
While we have all heard many times of the structural headwinds to inflation, we cannot ignore the above warning signs. And to put it all in perspective, as we mentioned last month, the average Wal-Mart trip today costs 5% more than it did a year ago – with all due respect to government pricing data, we would argue the Wal-Mart shopping cart is more reflective of the price increases in the average U.S. consumer basket.
As central bank policies have become ever more accommodative and risk assets have rallied on the so‑called central bank put, an inflationary surprise leading to an increase in inflation expectations could quickly shorten the tenor of this “put,” potentially sending markets in reverse and increasing real rates. Such an outcome would be one of the most painful environments for investors as the potential benefits of diversification would likely fail to materialize.
Because of the significance posed by the risk of inflation, particularly at this stage of the monetary cycle, we will continue to pay special attention to price levels and share any important insights.
In addition to our outlook on broad asset classes, Janus Henderson’s Adaptive Multi-Asset Solutions Team relies on the options market to provide insights into specific equity, fixed income, currency and commodity markets. The following developments have recently caught our attention:
Growth: Global equity attractiveness is below average levels. From a relative point of view, Japan is marginally more attractive within developed markets. Two positive regional outliers are Australia and Spain, while the UK represents a large negative outlier.