Subscribe
Sign up for timely perspectives delivered to your inbox.

Inflation has remained a stubbornly elusive phenomenon in the post Global Financial Crisis era. This is despite low real interest rates, a sharp increase in money supply and strong labor markets. Many have concluded there are structural impediments keeping a lid on prices. While true trends such as technological innovation and an aging population are disinflationary in nature, we must keep in mind that longer-term structural impediments do not mean cyclical bouts of inflation cannot emerge from time to time.
For the past several months, even while investors have digested slowing global growth and low-to-negative interest rates, options markets are sensing the whiff of inflation, and in our opinion this is not a refreshing scent but a dangerous one. In fact, we believe all the ingredients are in place for a surprise upsurge in prices and that investors are ignoring these conditions at their own peril.

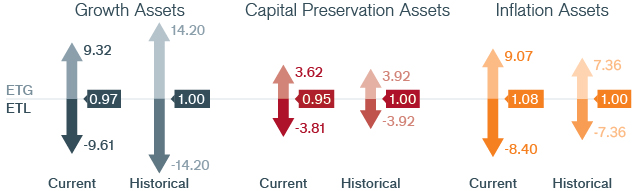
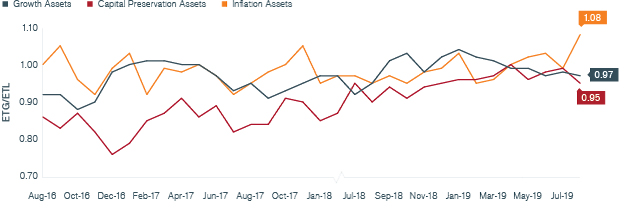
Our Adaptive Multi-Asset Solutions Team arrives at its monthly outlook using options market prices to infer expected tail gains (ETG) and expected tail losses (ETL) for each asset class. The ratio of these two (ETG/ETL) provides signals about the risk-adjusted attractiveness of each asset class. We view this ratio as a “Tail-Based Sharpe Ratio.” These tables summarize the current Tail-Based Sharpe Ratio of three broad asset classes.
As central bank policies have become ever more accommodative and risk assets have rallied on the so‑called central bank put, an inflationary surprise could quickly shorten the tenor of this “put” and send markets in reverse.
So what could cause inflation? To name a few: a weakening dollar, tariffs, the continued fall in excess reserves (which have fallen by over $1 trillion from their 2014 peak), increasing money in circulation in the economy and ultra-accommodative monetary conditions. And inflation is being felt by the retail sector as a recent analysis shows that the average trip to a leading U.S. retailer today cost 5% more than a year ago. Our concern is that this anecdotal evidence appears in other sectors and only makes its way into official indices after an acceleration in prices has taken hold, thus catching policy makers off-guard.
We consider inflation one of the most pernicious risks to financial assets, particularly given how late we probably are in the economic cycle. Its emergence would chase the policy doves away, potentially draining liquidity and raising real rates too quickly. Higher real rates equates to expensive money, which is often the decisive factor in tipping the economy into recession. For decades, this cascade of events has been the Achilles heel of all central banks.
Because of the significance inflation risk poses, particularly at this stage of the monetary cycle, we will continue to pay special attention to price levels and share any important insights with the readers.
In addition to our outlook on broad asset classes, Janus Henderson’s Adaptive Multi-Asset Solutions Team relies on the options markets to provide insights into specific equity, fixed income, currency and commodity markets. The following developments have recently caught our attention: