Subscribe
Sign up for timely perspectives delivered to your inbox.


Guy Barnard and Tim Gibson, Co-Heads of the Janus Henderson Global Property Equities Team, discuss the implications of negative-yielding bonds on listed property stocks and highlight the importance of active management in this environment.
In the summer months financial markets can often feel like they are in a state of limbo, with lower transaction volumes as people head to the beach. So far in 2019, we have seen a different type of limbo as global central bank policy has sent bond yields ever lower. Most market forecasters have had to rip up their predictions from the start of the year and are now expecting further interest rate cuts globally and a restart of quantitative easing in Europe.
With US$16trn* of debt instruments due to return to investors less than their current value, understanding and navigating the current investment environment has become even more challenging.
*Source: Bloomberg. Negative-yielding debt within the Bloomberg Barclays Global Aggregate Bond Index, as at 16 August 2019.
While we do not claim to have greater foresight than others in predicting the macro gyrations of the global economy, we have been sympathetic of the view that there are structural as well as cyclical reasons for growth and inflation to remain subdued.
The Global Property Equities Team sees this as a key tenet to provide ongoing support to income-producing assets like real estate and real estate investment trusts (REITs). It is one of the reasons we continue to strongly advocate an allocation to REITs as part of a balanced portfolio. Recent portfolio optimisation analysis shows that a 10% allocation to global REITs can provide the optimal Sharpe ratio (the higher the ratio the better the risk-adjusted return) within a typical balanced portfolio. **
**Source: Janus Henderson Investors as at June 2019. Based on analysis of asset class weights and risk/return characteristics in an optimal portfolio (maximum Sharpe ratio) when the FTSE EPRA Nareit Developed Index is included/excluded from the baseline balanced market portfolio. Past performance is not a guide to future performance.
On the positive side, we find ourselves asking what is the right yield (or cap rate) for real estate in a world of historically low or even negative bond yields. The following chart illustrates that the long-term ‘risk premium’ for real estate versus long-dated government bond yields in the US has been c.4% but today stands at close to 5%.
Therefore if investors believe that lower bond yields are here to stay, then perhaps we should expect a further move lower in yields (increase in real estate prices) from here. Transaction evidence year-to-date has shown robust demand in most property markets and some firmness in pricing across many sectors.
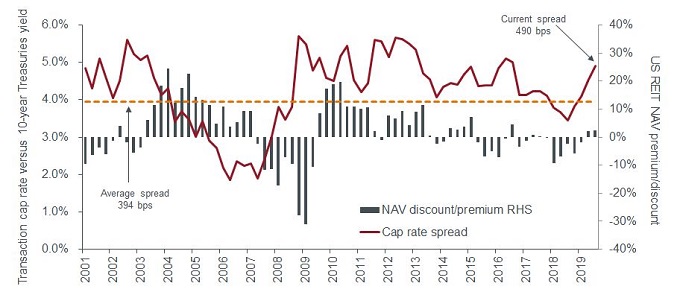 Note: NAV= net asset value. Cap rate = expected rate of return on property based on net income. CoStar cap rate data represents 40 US metropolitan statistical areas in the United States to end Q2 2019. Source: XoStar, Factset, S&P Global Market Intelligence, Raymond James research. Data as at August 2019. Past performance is not a guide to future performance.[/caption]
Historically, periods of elevated risk premiums for real estate have been associated with REITs trading at premiums to net asset value (NAV) as investors anticipate further capital growth. US REITs are currently trading broadly in-line with NAV and global REITs at a discount of c.10%, suggesting pricing is fair. This is reinforced by the fact that dividend yield spreads to BBB-rated corporate bonds are also close to the widest levels in the last decade.
However, we must also acknowledge the reason for today’s low bond yields and the associated macro and economic risks. Property yields are only likely to fall if investors feel they can rely on the income and feel confident the asset class can weather an economic downturn.
As growth become scarcer, it becomes more valuable. This reinforces our belief that in this backdrop, active management is required when investing in real estate and REITs. We continue to expect a two-tier market between different sectors. Our favoured sectors are those that are less economically sensitive, such as rental residential and net lease, and those benefiting from changes in technology, such as logistics and data centres. Conversely, we remain highly selective in sectors more sensitive to economic growth such as lodging and those, like retail, which are facing ongoing structural headwinds.
Recently we have seen equity markets react negatively to the inversion of the yield curve (yields on longer-dated 10-year government bonds are lower than shorter-dated two-year bonds, often a predictor of a recession). Looking at the US REIT market, analysis of historical yield curve inversions suggests that REITs could potentially outperform in the subsequent months. Following the previous two inversions in 2000 and 2006, REITs delivered more than 20% total returns within a year, and outperformed the broader equities market***.
Don’t stay away at the beach too long!
***Source: S&P Global Intelligence, Jefferies, SNL US REIT Equity Index. Past performance is not a guide to future performance.
Glossary:
Net lease is a contractual agreement where in addition to rent, the tenant is required to pay for the taxes, insurance and maintenance costs associated with the property.
Unless otherwise indicated, the source for all data is Janus Henderson Investors.