Subscribe
Sign up for timely perspectives delivered to your inbox.


Guy Barnard and Tim Gibson, Co-Heads of the Global Property Equities Team, provide a mid-year review on the performance of global REITs and their outlook for the rest of 2019.
Everyone loves completing their half yearly review. So we thought we would provide one for global real estate investment trusts (REITs).
Global REITs (FTSE Global NAREIT Developed Index in USD) rose by a respectable 15.4%, the Janus Henderson Horizon Global Property Equites Fund A2 share class in USD was up 19.4%, while global equities (MSCI World Index in USD) gained 17.4%. (Source: Morningstar, 1 January 2019 to 30 June 2019, NAV to NAV, net of fees, in USD, and Thomson Reuters Datastream, total returns in USD). Past performance is not a guide to future performance.
Not bad after the horrible end to 2018. The largest shift in market sentiment between the beginning of the year and now was on US interest rate expectations. To many, interest rate cuts seemed a long way off in January 2019, but have now become market consensus.
As always, one number tells us little about what really happened and within global real estate markets there was an ongoing battle between the ‘haves’ and the ‘have nots’.
It was winner takes all for industrial/logistics companies globally who made strong gains and were boosted by news that one of the world’s largest real estate private equity firms, Blackstone, had acquired GLP’s US industrial portfolio for US$18.7bn. The deal is one of the largest ever private real estate transactions and provided further evidence of both strong investor demand and supportive pricing for industrial assets. Conversely, retail names remained at the bottom of the pile in most markets as underlying valuations trended lower.
[caption id=”attachment_224509″ align=”aligncenter” width=”680″]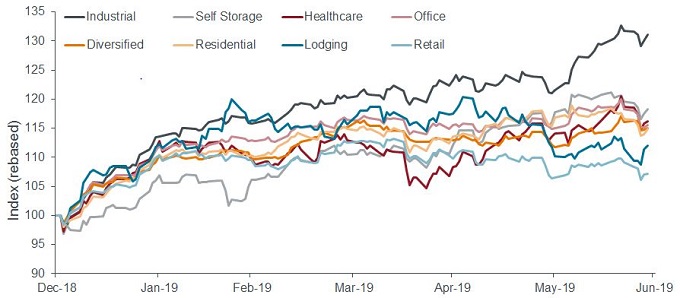 Source: Bloomberg as at 28 June 2019. US REITs sector indices in USD rebased to 100 at 31 December 2018. Past performance is not a guide to future performance.[/caption]
The global REIT sector also continued to grow, both through initial public offerings (IPOs) and existing companies raising funds for future growth. This has brought total assets in global REITs to US$1.8 trillion as at 30 June 2019 (Source: Bloomberg, FTSE EPRA/NAREIT Developed Index market capitalisation as at 30 June 2019). But again, the devil is in the detail as the vast majority of growth was in the faster-growing and ‘alternative’ sectors such as logistics, data centres, and manufactured housing.
This highlights not just the ability of REIT companies to grow organically, but also externally by acquiring assets to grow their platforms and further enhance earnings growth.
With the markets now expecting interest rates to be cut in the US, the only remaining questions seem to be how many cuts and when. The main reason behind this volte-face is ongoing concerns over slowing global growth.
As central banks re-converge to become dovish once more, REITs have the potential to benefit because the sector’s dividend yield remains attractive relative to the wider equity and bond markets. Furthermore, the beta of the global REITs sector versus global equities currently stands at 0.5 (one-year beta at 30 June 2019), which we believe may offer some downside protection.
As global economic growth slows and risks rise, we believe defensive growth is going to be a key area of focus for investors for the rest of the year, but as highlighted above, it is important to be selective‒ not all real estate sectors are created equal.
Glossary:
Beta is a measure of a portfolio’s (or security’s) relationship with the overall market or any chosen benchmark. The benchmark always has a beta of 1. A portfolio with a beta of 1 means that if the market rises 10%, so should the portfolio. A portfolio with a beta of more than 1 will be expected to move more than the market, but in the same direction. A beta of 0 means the portfolio’s returns are not linked at all to the market returns. A negative beta means the investment should move in the opposite direction to the market.