Subscribe
Sign up for timely perspectives delivered to your inbox.


The dovish tilt to global monetary policy should be supportive of asset prices in the near term but portfolio managers Tom Ross and Seth Meyer observe that an extension of the credit cycle does not mean abandoning selectivity within high yield bonds.
In 1968, in the Men’s 100 metre sprint, Jim Hines of the US hit a world record of 9.95 seconds and that record would stand unbeaten for 15 years, when Calvin Smith would shave 0.02 seconds off it in 1983. In 2009, Usain Bolt of Jamaica would cut 0.11 seconds off his own world record set a year before and bring the record to its current level of 9.58 seconds.
Sometimes records seem insurmountable, other times they are almost meaningless. The US economy stands at the threshold of a new record – if it grows through July, it will break the record for the longest unbroken expansion (120 months between March 1991 and March 2001).
Records matter in that they can create a psychological limit but just because something held true in the past does not mean it will do so in the future, particularly if circumstances change. So is the current economic expansion the equivalent of Usain Bolt – one that will power substantially past the previous record – or is it a Calvin Smith moment of limited advance?
The question is not an unreasonable one for high yield bond investors to ask. As lenders to companies we need to be confident that the economic environment a borrowing company is facing is favourable so that we will collect the bond repayments. Although corporate fundamentals drive the majority of performance in high yield bonds, we recognise that it has become increasingly important to consider macroeconomic factors.
The dovish shift by central banks is accentuating the grab for yield as expectations of further rate cuts intensify. Within the Bloomberg Barclays Global Aggregate Index the percentage of negative yielding assets reached a record high in June 2019, while the yield on the German 10-year Bund fell to a record low of -0.3%. Contrast that with an average yield of 5.9% for the ICE BofAML Global High Yield Bond Index in late June 2019. It is small wonder, therefore, that investors are moving into high yield as a source of income, which is evident from the fund flows data.
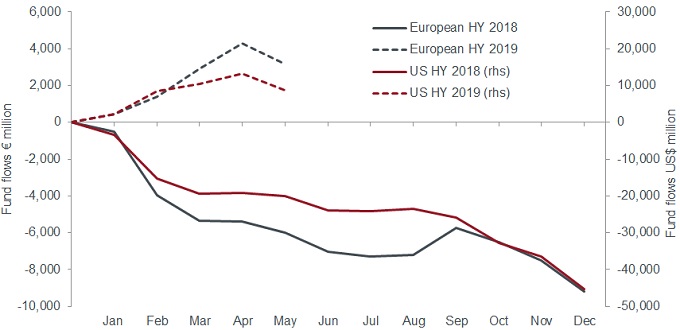 Source: European flows – JP Morgan, Bloomberg, includes ETFs; US flows – Barclays, Lipper, includes ETFs, as at 30 May 2019.[/caption]
Yet despite the broadly supportive technical backdrop of reasonable demand and subdued issuance (year-to-date net issuance in Europe remains below the levels seen over the same period in 2018, although US high yield gross and net issuance is higher) there has been a reluctance on the part of investors to drive credit spreads aggressively tighter. The chart below highlights how the decline in yields on global high yield bonds has been heavily influenced by a rates effect (the decline in equivalent government bond yields). The yield has declined from 7.5% (750 basis points) in December 2018 to 5.9% in June 2019 yet spread narrowing accounts for only 100 basis points of the 160 basis points fall.
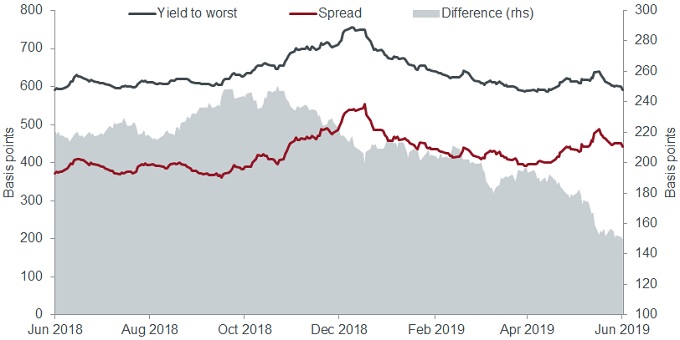 Source: Bloomberg, ICE BofAML Global High Yield Bond Index, 18 June 2018 to 18 June 2019. 100 basis points = 1%.[/caption]
In fact, if we take the difference between the yield and credit spread as a proxy for the rates effect we can see that rates have been helping to offset spread widening episodes in Q4 2018 and May 2019.
These spread widening episodes bring us back to our opening analogy on how long the economic expansion can continue as they each correspond to growth scares: Q4 2018 reflecting concern that the Fed was making a policy error by overtightening; and May 2019 reflecting fears that trade war escalation would push a weakening global economy over the edge.
The U-turn by central banks towards additional policy easing needs context. It is only taking place because economic data has weakened. The Trump tax stimulus is fading, business confidence and purchasing manager indices globally are declining, and manufacturing, particularly autos, is feeling the combined impact of a slowdown in China and industry disruption. To be fair, employment levels and wage growth have been robust but these tend to roll over later in response to prolonged weakness at the corporate level.
What is astonishing is that the US Federal Reserve has altered course over the summer without significant market weakness. This may tell us one of two things. Either it is genuinely concerned that the economic weakness is structural and that the US/global economic expansion has reached its limit. Or, it is acting pre-emptively in the belief that this is simply a mid-cycle slowdown and that early action can extend the cycle.
In pledging “to act as appropriate to sustain the expansion”, the Fed is joined by the European Central Bank (ECB) promoting further policy easing and central banks as far afield as Australia cutting rates. There is also increasing support for fiscal expansion, framed by politicians with an eye on growing populism. Taken together, accommodative monetary policy and greater government spending should extend the credit cycle.
Against this backdrop global high yield fundamentals are reasonable in both the US and Europe. Interest coverage remains high relative to history, despite some deterioration in the US. We expect leverage to head higher in 2019 as earnings soften and the deleveraging which has been taking place within the energy sector since its crisis in 2015 begins to fade. Leverage levels do not look excessive, however, and with the backdrop of easier policy should create the conditions for spread tightening.
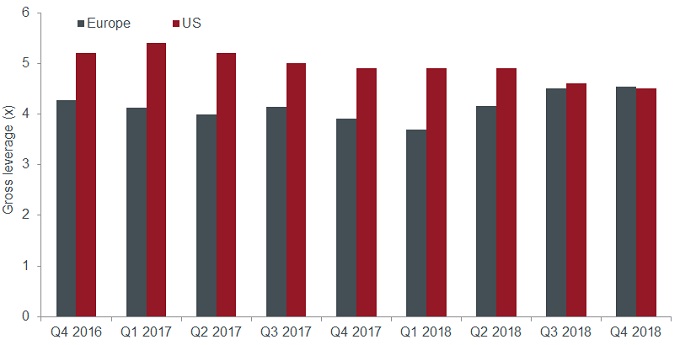 Source: European gross leverage – Morgan Stanley Research, Bloomberg, using a sample from the European iBoxx HY index, as at 31 December 2018. US gross leverage – Credit Suisse, Credit Suisse Liquid US High Yield Index as at 31 December 2018. Gross leverage = Total debt/EBITDA (earnings before interest, tax, depreciation and amortisation).[/caption]
In such circumstances, we see better value in European high yield compared with US high yield. This is because at a ratings-adjusted level the European market offers more attractive spreads in absolute terms and in terms of the gap between current levels and recent tights (lows). The risk of a rate rise from the ECB is also smaller and the likelihood of corporate bond purchases greater – both of which should help drive spreads tighter.
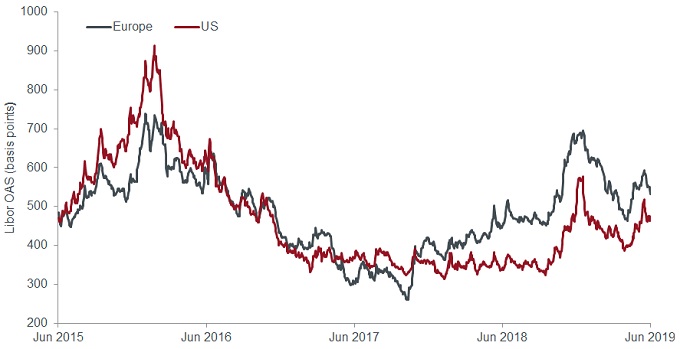 Source: Bloomberg, ICE BofAML European Currency High Yield B Index (HP20), ICE BofAML US High Yield B Index (H0A2), 19 June 2015 to 19 June 2019. Libor option-adjusted spread.[/caption]
Yet, the longer the cycle extends, the more likely that bondholder-unfriendly late-cycle behaviour builds. While the high yield sector has actually been better behaved than the investment grade sector this year in terms of a higher proportion of primary use of proceeds going towards debt refinancing and repayments (75% of US high yield compared to just 30% of US investment grade*), the prospect of looser policy could undo this. Meanwhile the build-up of leverage in investment grade risks a flood of downgrades into high yield.
*Source: Dealogic, Goldman Sachs, year to date use of proceeds, 18 June 2019.
Looking at the European high yield bond market to mid-May we can see a marked dispersion in returns.
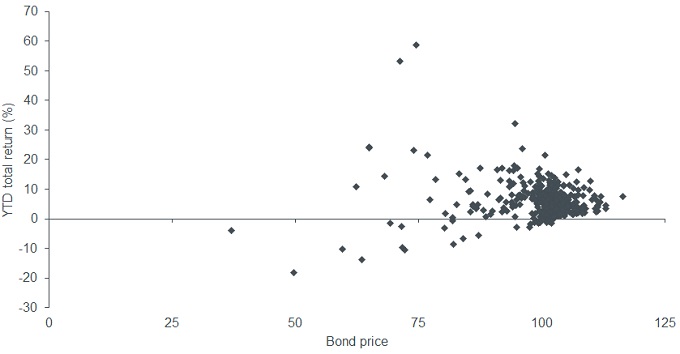 Source: Credit Suisse, Credit Suisse Liquid European High Yield Index, year-to-date returns to 15 May 2019. Past performance is not a guide to future performance.[/caption]
This was, in aggregate, a period of positive returns for high yield. A move from risk-on to a risk-off environment could easily see similarly wide dispersion but with a negative return bias. We believe that global high yield will attract investors in coming months, but geopolitical concerns, rising corporate costs, fragility in economic data and the effects of disruptive competition on individual credits means it is worth building some defence into a portfolio. In our view, this means engaging in ‘quality control’, not necessarily in terms of higher credit ratings but in identifying issuers where directional improvement in cash flows and balance sheets is evident.