Subscribe
Sign up for timely perspectives delivered to your inbox.
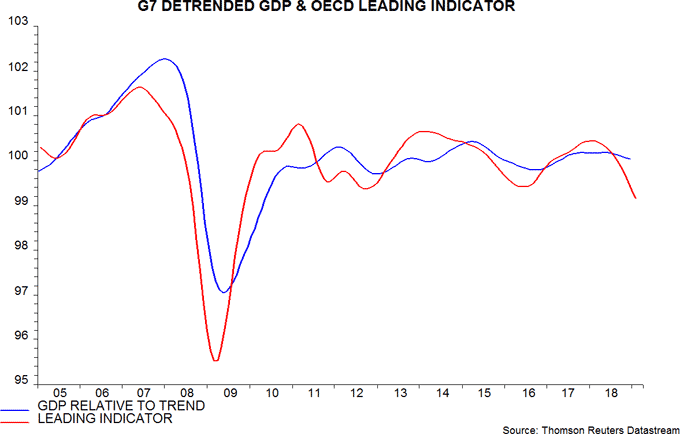
The OECD’s composite leading indicators support the expectation here of a further loss of global economic momentum into mid-2019.
The OECD’s indicators provide an independent, though less timely, cross-check of signals from monetary trends. With rare exceptions (e.g. Canada, India), the country indicators do not contain a monetary component. They tend to be dominated by business and consumer survey information, though also include financial indicators such as equity prices and the yield curve.
As previewed in a post last week, the G7 composite indicator registered another significant monthly fall in January, suggesting that GDP expansion will remain well below trend over coming months – see first chart.
The OECD’s practice of presenting its indicators in trend-adjusted form obscures important information about their internal momentum. An alternative approach followed here involves:
Historically, turning points in the six-month change in the indicator have led turning points in six-month output momentum by four to five months on average – second chart.
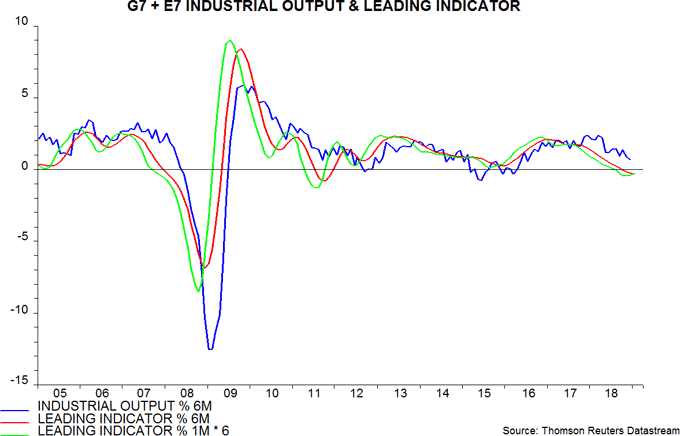
The central view here, based on monetary trends, is that global six-month industrial output momentum will bottom around July 2019. Such a scenario would suggest a low in the six-month change of the leading indicator in February or March.
Consistent with this scenario, the six-month indicator change continued to weaken in January. The one-month change, however, recovered marginally – this could be a precursor to the six-month change bottoming over the next several months.
The suggestion that economic momentum will reach a low around July does not imply an optimistic assessment of prospects for later in 2019. Developments judged here to be necessary to warrant such an assessment include:
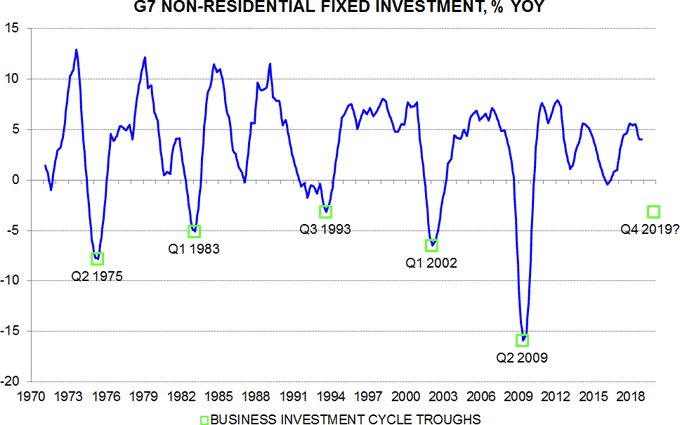
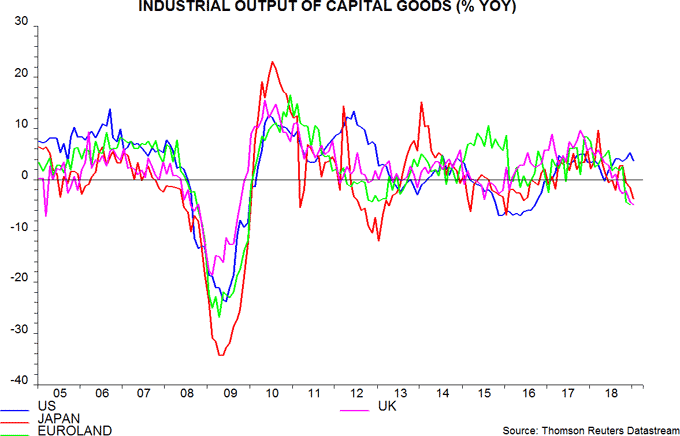
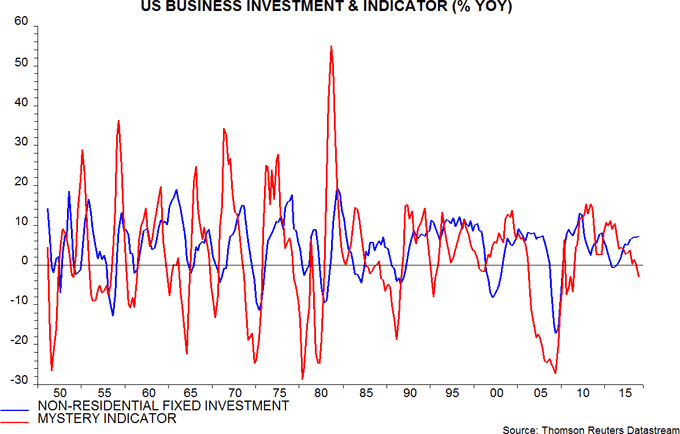
On the latter point, a correspondent asked whether solid investment data for the US and Euroland in the fourth quarter of 2018 altered the assessment here about the timing and magnitude of a cycle downswing. The answer is no. Year-on-year growth of G7 non-residential fixed investment was unchanged in the fourth quarter and below a peak reached in the second quarter – third chart. Investment is closely correlated with industrial output of capital goods, which fell significantly year-on-year in Japan, Euroland and the UK in December / January – fourth chart. The relationship shown in the fifth chart, meanwhile, suggests that US investment resilience will crumble – the identity of the mystery indicator may surprise readers.
