Subscribe
Sign up for timely perspectives delivered to your inbox.

Global industrial weakness, as expected, has intensified in early 2019. Based on last week’s flash results for the US, Japan and Euroland, the global PMI manufacturing new orders index is estimated to have fallen below 50 in February, reaching its lowest level since 2012 – see first chart. The final reading will depend importantly on Chinese results released on Friday.
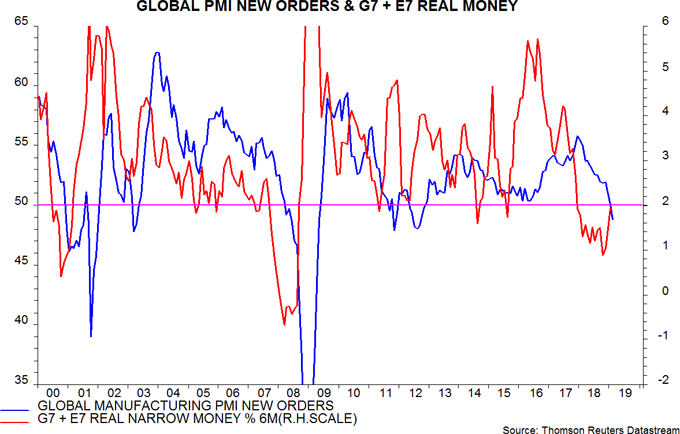
As previously discussed, six-month growth of global real narrow money bottomed in October, implying a low in industrial output momentum around July 2019, allowing for a typical nine-month lead. PMI new orders usually move slightly ahead of hard output data, so could reach a trough some time in the second quarter.
Global real narrow money growth remains weak, arguing against a strong PMI rebound. Current money trends contrast markedly with mid 2012 and early 2016 when the prior two economic slowdowns were coming to an end.
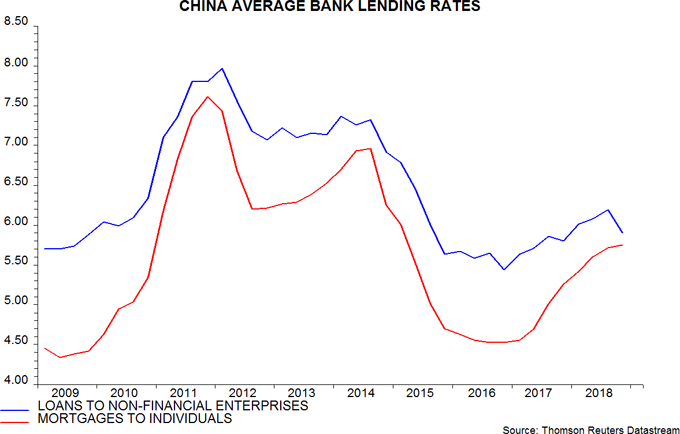
Hopes of significantly stronger narrow money growth rest mainly on a pick-up in China in response to policy easing. Six-month expansion of our Chinese true M1 measure rose in January but New Year timing can distort the data at this time of year – February numbers will be key for assessing whether the trend has turned. Chinese money market rates have fallen further but pass-through to lending rates, particularly mortgages, is proving slow – second chart (the last data points are for December).
A turnaround in the global PMI could be driven by a moderation of Euroland weakness. Euroland new orders have undershot the global aggregate but real money growth has recovered since July 2018 and was stronger than elsewhere in December (January figures are released tomorrow) – third chart.
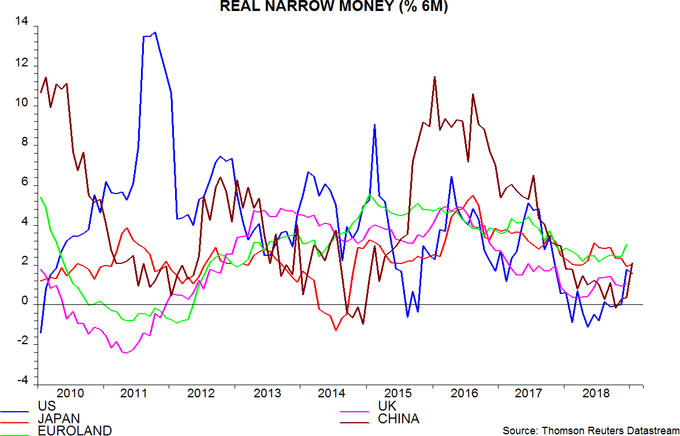
US and Chinese real narrow money trends were weak until December / January, suggesting that PMI new orders will decline further (US) or remain soft (China) through the first half.
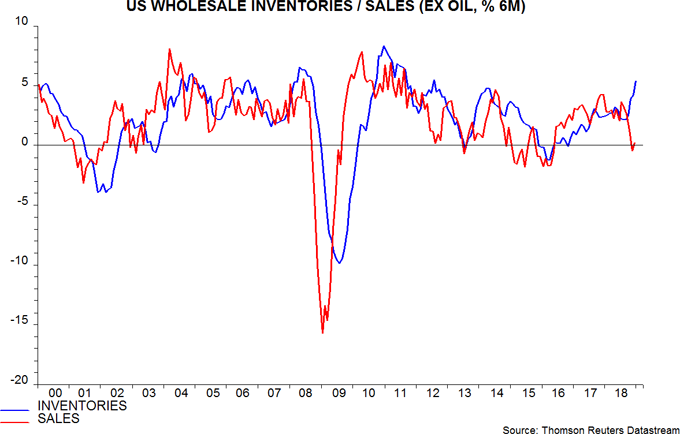
Previous posts argued that a downswing in the global stockbuilding cycle would depress economic momentum in late 2018 and through most of 2019. Available national accounts data indicate a significant negative GDP impact in Euroland in the fourth quarter but the US cycle is lagging: wholesale inventories surged in late 2018, diverging from weak sales – fourth chart. US inventory adjustment could contribute to surprisingly weak GDP expansion during the first half.
Some commentators have cited a pick-up in US broad money growth in late 2018 / early 2019 as a reason for economic optimism. This acceleration partly reflects solid bank lending expansion, driven by commercial and industrial loans. C&I loan strength, however, is the counterpart of the build-up in stocks – see previous post – and is likely to reverse as these are adjusted, suggesting a slowdown in broad money.