Subscribe
Sign up for timely perspectives delivered to your inbox.

Since the beginning of the year, the key catalysts for a “right tail” event to unfold have fired on all cylinders, namely an ease on monetary tightening by the Federal Reserve (Fed), lower trade tensions and a strong earnings season. New catalysts that could propel risk assets forward are not so apparent, and those that could – such as a de-escalation of tensions with North Korea, after a failed summit – are unlikely to have as significant an impact. Consequently, the options market does not see a clear path forward favoring risk assets. The potential upside compared to the potential downside for global equities, a measure of “cheapness,” has drifted from extremely cheap levels at the start of the year to just average levels today.
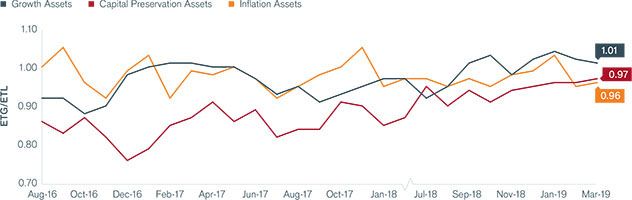
Beginning in August 2016, the “Tail-Based Sharpe Ratios” have been normalized to 1.00 to allow for easier comparison across the three macroeconomic asset categories.

Beginning in August 2016, the “Tail-Based Sharpe Ratios” have been normalized to 1.00 to allow for easier comparison across the three macroeconomic asset categories.
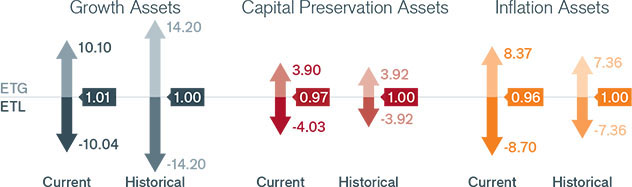
Our Adaptive Multi-Asset Solutions Team arrives at its monthly outlook using options market prices to infer expected tail gains (ETG) and expected tail losses (ETL) for each asset class. The ratio of these two (ETG/ETL) provides signals about the risk-adjusted attractiveness of each asset class. We view this ratio as a “Tail-Based Sharpe Ratio.” These tables summarize the current Tail-Based Sharpe Ratio of three broad asset classes.
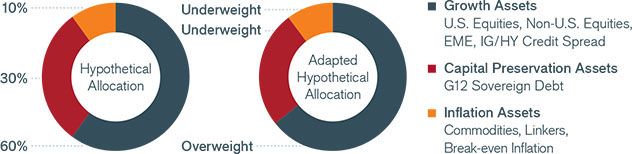
Global equities, however, are not devoid of opportunities, and we see an interesting rotation unfolding. The epicenter of attractiveness is now outside the U.S., particularly Asia. In fact, the attractiveness of U.S. equities is below its longer-term average. Japan, Korea, India and China, on the other hand, represent some of the most attractive equity markets, according to the levels of expected upside versus downside priced into the options markets. While U.S. stocks have been the bedrock in the global equities rally over the last several years, an inflection point may well be forming.
Inflation signals have marginally moved up from last month and, in our opinion, an upward price pressure continues to represent the most important risk to monitor, as the course of future Fed policy will largely be dictated by inflation.
After the violent “roller-coaster” ride we have just experienced with equities, there are number of conflicting signals, from strong labor numbers to weak trade numbers, as to the direction equities will follow. Actively monitoring changes in risk dynamics and responding to these changes is crucial at these times and we remain vigilantly focused on this.
In addition to our outlook on broad asset classes, Janus Henderson’s Adaptive Multi-Asset Solutions Team relies on the options market to provide insights into specific equity, fixed income, currency and commodity markets. The following developments have recently caught our attention:
Data was not calculated for all months.
*We define ETG and ETL as the 1-in-10 expected best and worst two-month return for an asset class.