
Key takeaways:
- While the speed of the market sell-off following Trump’s April 2 global tariffs announcement was unusual, pullbacks of 5% or more happen in most calendar years – including those when the S&P 500 Index finished with positive returns.
- Despite the emotional pull, we believe it’s prudent for investors to stay the course with their long-term objectives, even in volatile markets. History shows stocks have often gone on to stage significant moves to the upside following a drawdown.
- In our view, it’s an active manager’s job to focus on upgrading portfolios amid volatility by mining for attractive entry points in the strongest companies that can adapt and thrive.
Within days of President Trump’s April 2 announcement of global tariffs – which shocked financial markets globally for their scale and size – the S&P 500® Index had lost just over 12% of its value. Even more quickly, after the president authorized a 90-day pause on said tariffs (excluding China), the benchmark staged one of its most impressive one-day rallies ever.
Drawdowns are more frequent than not
The continued volatility has left many investors asking, “This isn’t normal, right?”
The answer to that question is more nuanced than might first appear. In the last 25 years or so, the S&P 500 has experienced more than a half dozen bear markets (a decline of 20% or more from recent highs), with price declines of 5% or more occurring in most calendar years – including those when the benchmark finished with positive returns.
Exhibit 1: Historical S&P 500 Index declines
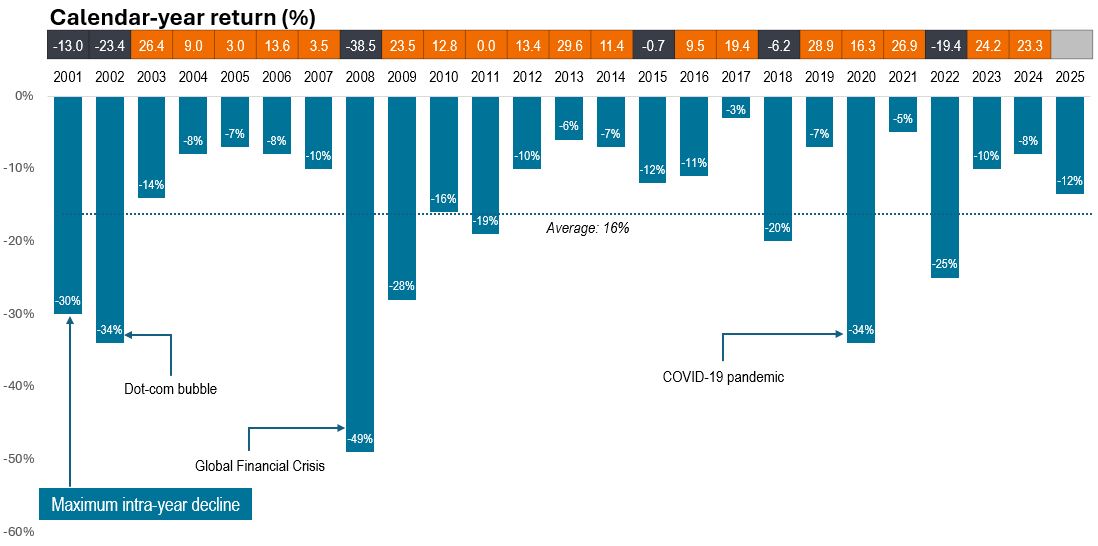
Source: FactSet, S&P U.S. Data from 31 December 2000 to 8 April 2025. Returns reflect price change. Past performance is no guarantee of future results.
What was unusual this time around was the speed of the sell-off. The S&P 500 dropped -4.8% on April 3, followed by a fall of -6.0% the following day. That marked only the 13th time since 1929 that the benchmark experienced back-to-back trading days with declines of -4.5% or more.
Such large market moves in such a compressed period can make it tempting for investors to run for safety. But history suggests that impulse might not be the correct one. Volatility begets volatility, with a rise in short-term and algorithmic trading activity helping intensify intraday price swings. But stocks have often gone on to stage significant moves to the upside following these drawdowns.
Case in point, only days after the tariff-induced sell-off, the S&P 500 snapped back on April 9, rallying 9.5%. The one-day turnaround was not enough to retrace all the S&P’s losses, but it still ranks among the top 10 of one-day gains in the index’s history (Exhibit 2). Notably, the three consecutive sessions from April 7 to 9 were each among the 35 most volatile on record based on intraday highs and lows.1
Exhibit 2: S&P 500: 15 best one-day percent changes in history
| Rank | Date | Event | 1-day percent change |
| 1 | Mar 15, 1933 | End of bank holiday | 16.61% |
| 2 | Oct 30, 1929 | Post-crash rebound | 12.53% |
| 3 | Oct 6, 1931 | Bank support plan | 12.36% |
| 4 | Sep 5, 1939 | War uncertainty eases | 11.86% |
| 5 | Sep 21, 1932 | Stimulus hopes | 11.81% |
| 6 | Oct 13, 2008 | Bank rescue plan | 11.58% |
| 7 | Oct 28, 2008 | Rate cut anticipation | 10.79% |
| 8 | June 22, 1931 | Eco recovery hopes | 10.51% |
| 9 | April 20, 1933 | Gold standard suspended | 9.52% |
| 10 | April 9, 2025 | Trump tariff pause | 9.52% |
| 11 | Mar 24, 2020 | Fed unlimited QE | 9.38% |
| 12 | Mar 13, 2020 | Stimulus speculation | 9.29% |
| 13 | Aug 8, 1932 | Speculative rally | 9.26% |
| 14 | Oct 21, 1987 | Post-Black Monday rebound | 9.10% |
| 15 | Nov 14, 1929 | Fed loan rate cut | 8.95% |
Source: Bloomberg, as at 10 April 2025. Past performance is no guarantee of future results.
Where to from here?
Much remains unknown about the next stages of the trade war, with the potential near- and long-term investment and economic implications likewise unclear. For now, investors are weighing the potential inflationary impact of tariffs and how consumers will react to higher prices. Continually shifting trade terms also raise questions about how long tariffs will last and at what level, and how companies will adapt to the new operating environment.
Given the uncertainty, it would be prudent to expect further volatility. And while market volatility is inherently unsettling, it’s important to note that it is not necessarily a harbinger of a downward trend. In fact, significant spikes in volatility – as measured by the VIX Index – have often signaled future gains (Exhibit 3).
Exhibit 3: VIX spikes above 40
| Date VIX crossed 40 | VIX closing price | S&P 500 return, next 12 months |
| Aug 31, 1998 | 44.28 | 39.79% |
| Sep 17, 2001 | 41.76 | -14.64% |
| July 22, 2002 | 41.87 | 22.71% |
| Sep 19, 2002 | 40.65 | 25.12% |
| Sep 29, 2008 | 46.72 | -1.55% |
| May 7, 2010 | 40.95 | 23.60% |
| Aug 8, 2011 | 48.00 | 28.07% |
| Sep 22, 2011 | 41.35 | 32.17% |
| Aug 24, 2015 | 40.74 | 18.07% |
| Feb 28, 2020 | 40.11 | 34.39% |
| June 11, 2020 | 40.79 | 43.71% |
| Oct 28, 2020 | 40.28 | 42.57% |
| April 4, 2025 | 45.31 | — |
Source: Bloomberg, as at 17 April 2025. VIX spikes based on latest price. Spikes above 40 noted if they occur more than one month after the previous spike. Past performance is no guarantee of future results.
The potential for short periods of volatility to lead to longer-term stretches of gains shows that it has often paid to ride out the inevitable fluctuations. Furthermore, the swiftness of recent moves makes it clear that trying to time the market can cause more damage to a portfolio than market volatility itself, as illustrated in Exhibit 4.
Exhibit 4: The downside of trying to time the market
Value of a hypothetical $10,000 investment in the S&P 500 Index from 1999 – April 2025
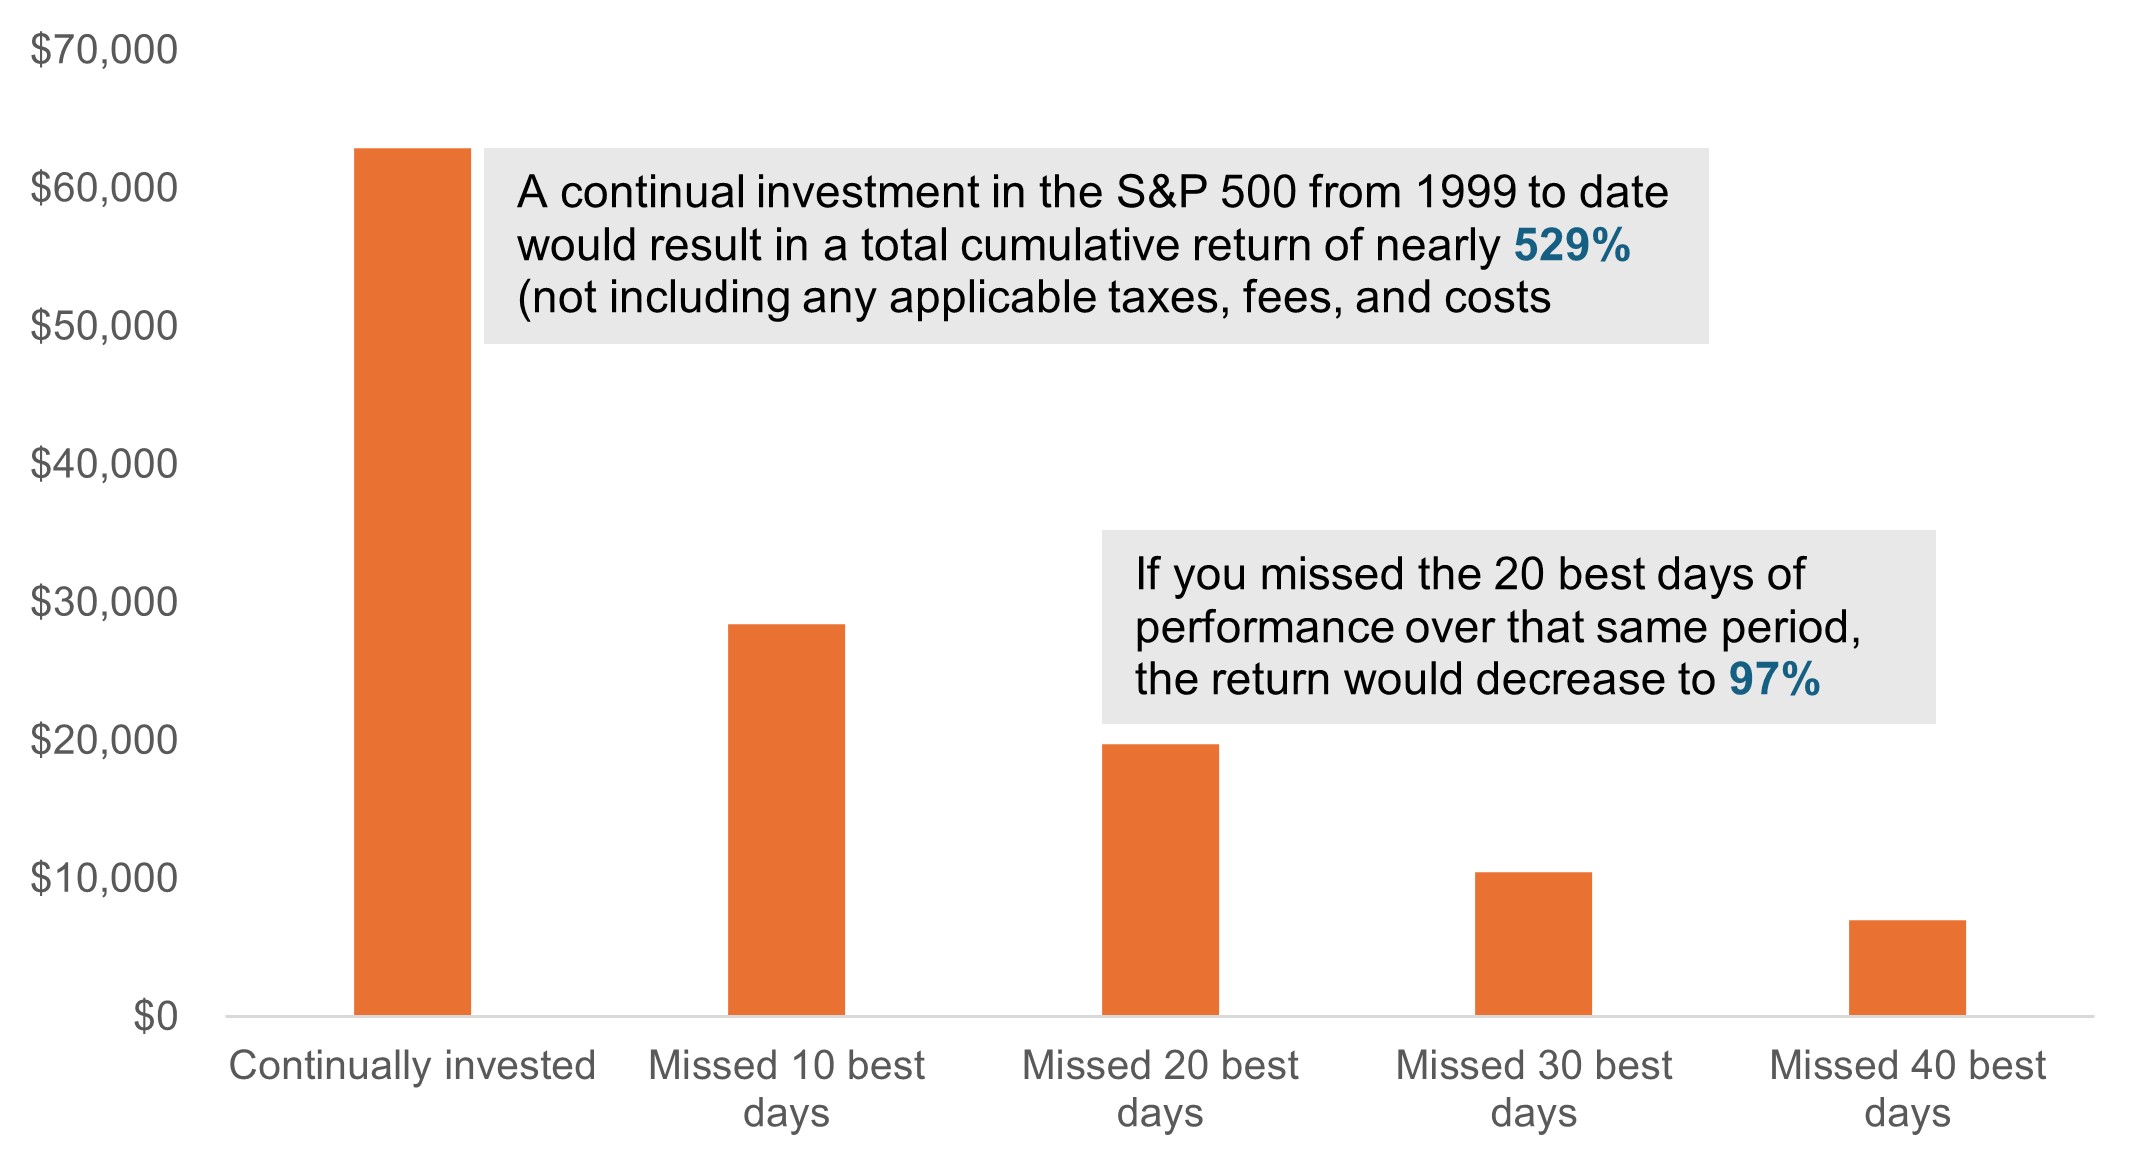
Source: Bloomberg, Janus Henderson Investors. As at 21 April 2025. Past performance is no guarantee of future results.
The value of active management in volatile markets
For investors with longer-term horizons, staying in the market has ultimately paid off. This is especially the case when volatility presents an opportunity to upgrade portfolios.
As active managers, in times of significant volatility, we seek to take advantage of attractive entry points on stocks where valuation may have previously prevented our investment. We also have the latitude to look at a wider spectrum of companies, beyond the indices, to find quality business models and companies we think have the potential to outperform over the long term.
We know that a new paradigm for global trade – regardless of its ultimate form – will present both opportunities and risks, and companies with proven management teams, quality business models, competitively advantaged products, and/or strong intellectual property should hold their own. We believe this is an era when companies with tenuous business models and backward-looking, reactive strategies may fracture – but when the strongest companies can still thrive.
1 Source: Sherwood News, Bloomberg data as at 10 April 2025.
All data sourced from Bloomberg, as at 17 April 2025, unless otherwise noted.
S&P 500® Index reflects U.S. large-cap equity performance and represents broad U.S. equity market performance.
Cboe Volatility Index® or VIX® Index shows the market’s expectation of 30-day volatility. It is constructed using the implied volatilities of a wide range of S&P 500® Index options and is a widely used measure of market risk. The VIX Index methodology is the property of Chicago Board of Options Exchange, which is not affiliated with Janus Henderson.
Volatility measures risk using the dispersion of returns for a given investment.
IMPORTANT INFORMATION
Actively managed investment portfolios are subject to the risk that the investment strategies and research process employed may fail to produce the intended results. Accordingly, a portfolio may underperform its benchmark index or other investment products with similar investment objectives.
Equity securities are subject to risks including market risk. Returns will fluctuate in response to issuer, political and economic developments.
These are the views of the author at the time of publication and may differ from the views of other individuals/teams at Janus Henderson Investors. References made to individual securities do not constitute a recommendation to buy, sell or hold any security, investment strategy or market sector, and should not be assumed to be profitable. Janus Henderson Investors, its affiliated advisor, or its employees, may have a position in the securities mentioned.
Past performance does not predict future returns. The value of an investment and the income from it can fall as well as rise and you may not get back the amount originally invested.
The information in this article does not qualify as an investment recommendation.
There is no guarantee that past trends will continue, or forecasts will be realised.
Marketing Communication.