Is convertible arbitrage making a comeback in liquid alternative portfolios?
Convertible bonds are back in vogue, after being sidelined in investors’ portfolios since 2022. But why? And for how long? Diversified Alternatives Portfolio Managers Natasha Sibley and Paul Bryant, with Client Portfolio Manager Alistair Sayer, give their insight.

6 minute read
Key takeaways:
- For almost a decade, convertible arbitrage, once a foundation strategy for absolute return investors, has been unloved and a meagre source of returns.
- The market has been dominated by price insensitive, long-only investors. That, however, now seems to be changing.
- We see increasingly attractive valuations for convertible bonds and potential for continued new issuance to underpin a revival of this stalwart strategy.
Convertible bonds, fixed income assets that can be ‘converted’ into common stock or equity shares, have been the preserve of long-only convertible bond funds since the Global Financial Crisis (GFC). The crisis was perhaps the catalyst for that long-only dominance, as we saw prices on convertibles plummet through their bond floors. Long-only convertible bond strategies tend to be relatively price insensitive when it comes to their bond/equity combination. This has meant that investment banks have been able to offer combinations of equities and options to create synthetic bonds, sell them to long-only funds – and still turn a profit.
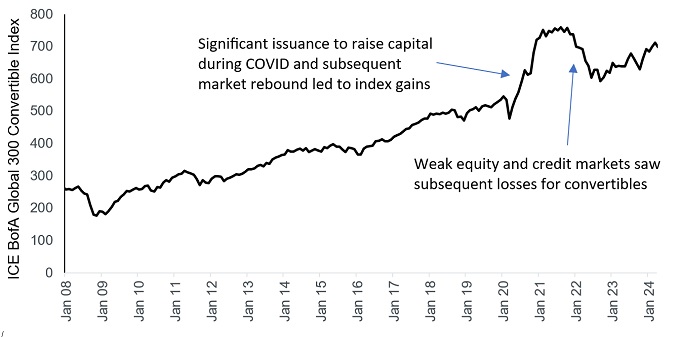
Additionally, 2020 and 2021 saw significant issuance, as companies opted for convertibles as quick ways to raise capital to repair their COVID-impacted balance sheets. Some of these bonds came with spectacularly high valuations, reflected by the jump higher in the index (Exhibit 1), but still found willing buyers in the long-only market, where funds need to manage against a benchmark, which included these new issues.
Exhibit 1: ICE BofA Global 300 Convertible Index

Source: Bloomberg, Janus Henderson Investors, ICE BofA Global 300 Convertible Index, 31 January 2008 to 31 March 2024. ICE BofA Global 300 Convertible Index: A global total return index composed of convertibles issued by companies representative of the market structure of countries in North America, Europe and the Asia/Pacific region, denominated in their local currencies. Past performance does not predict future returns.
However, this all changed in 2022, when weak equity and credit markets fed through to significant losses for convertibles. Not on the scale that we saw in the GFC, where prices for convertibles fell by as much as 35%, but still significant. This time round, however, it opened the door to the return of the price sensitive absolute return buyer, with hedge fund market participation rising to its highest level since before the GFC in 2023 (Exhibit 2).
Exhibit 2: The return of price-disciplined buyers (hedge funds)

Source: BofA Merrill Lynch Global Research, ICE Data Indices, LLC, Bloomberg, Janus Henderson Investors Analysis, as at 30 June 2023. Hedge fund convertible bond market participation. Past performance does not predict future returns.
Note: There is no guarantee that past trends will continue, or forecasts will be realised.
Is the door opening to renewed convertible arbitrage in liquid alternatives strategies?
Overall, 2024 has been a strong year for new convertible bond issuance thus far, with the total volume of debt issued already above the level achieved across the entirety of 2022, reflecting what we would argue represents more rational demand.
This bumper period of growth is attributable to several factors:
- Refinancing demands: With a relatively high proportion of existing convertible bonds maturing recently or in the near future, many issuers are reviewing their refinancing needs.
- Cost: A higher interest rate environment meant that the lower coupons found on convertible bonds have represented a potentially more cost-efficient option for issuers, relative to the coupon on straight (or non-convertible) bonds. This is particularly the case for smaller, often innovative ‘early cycle’ companies looking for funding at a slightly lower cost than straight bonds.
- Rate cut expectations: Recent lower inflation numbers have seen interest rates ease in the mid-part of the yield curve. This is the typical tenor of convertibles (eg. five years) bolstering small caps/technology stocks, meaning that companies can issue convertibles on relatively good terms.
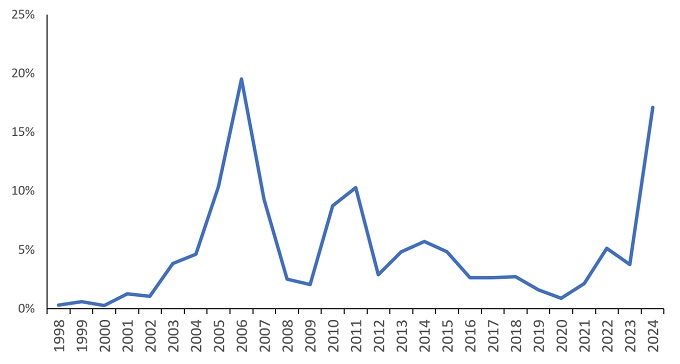
While the reasons for issuance are varied, one new theme has emerged this year in a big way – companies issuing convertibles in order to buy back their stock. Exhibit 3 shows the percentage of global convertible bond deals where stock buyback was listed as the purpose:
Exhibit 3: The volume of convertibles issued to fund share buybacks has risen sharply

Source: BofA Merrill Lynch Global Research, Janus Henderson Investors Analysis, 1 January 1998 to 30 June 2024. Percentage of global convertible bond deals where stock buyback was the purpose. Past performance does not predict future returns.
Two significant names that have issued convertible bonds in 2024 to fund share buybacks are Alibaba and JD.com.
Multinational technology company Alibaba made history in May 2024 with the largest standalone convertible bond ever issued in the US (BABA 2031). The deal totaled up to US$5 billion and surpasses the previous largest convertible bond deal (US$4.95 billion), issued by Ford in 2006[1]. The convertible bond from Alibaba came hot on the heels of a US$2 billion issuance from technology and service provider JD.com[2], which has been pursuing a significant share buyback program to help improve shareholder returns under pressure from high price competition from its domestic rivals.
What does this mean for the convertible bond market?
We think the current environment is opening the door to more opportunities for convertible bond arbitrage – the opportunity to capitalise on the mispricing between a convertible bond and its underlying equity. While the pain of 2022 hurt long-only convertible bond fund returns, naturally leading to outflows, current experience suggests that the convertible bond market in general is more price sensitive and valuations are becoming more attractive. Overall, a combination of increasing primary activity and lower valuations means convertible bond arbitrage looks like an interesting space to allocate risk.
The topic of rates is inevitably a relevant one for investors considering an allocation to convertibles. The Bank of England reduced interest rates to 5% at the start of August, from 5.25%, the first cut since March 2020. The economic toll of higher rates has added pressure on the Fed to follow suit.
Interest rates have the same inverse correlative impact on convertible bonds as they do on regular corporates – a cut in interest rates would be expected to feed through to higher valuations.
This is particularly true for smaller caps, which tend to be more sensitive to interest rates than their larger peers, given the higher costs associated with borrowing (and greater allocation to floating rate debt). This suggests that we could see increasing issuance from companies further down the market cap scale, as smaller companies look to issue lower-cost debt; the target market being investors who are willing to allocate their cash in the expectation that the underlying stock could rise in value.
[1] Source: Ford Motor Company, December 2006 Annual Report.
[2] Source: JD.com, 23 May 2024.
Balance sheet: A financial statement that summarises a company’s assets, liabilities and shareholders’ equity at a particular point in time. Each segment gives investors an idea as to what the company owns and owes, as well as the amount invested by shareholders. It is called a balance sheet because of the accounting equation: assets = liabilities + shareholders’ equity.
Credit spread: The difference in yield between securities with similar maturity but different credit quality, often used to describe the difference in yield between corporate bonds and government bonds. Widening spreads generally indicate a deteriorating creditworthiness of corporate borrowers, while narrowing indicate improving.
Fixed income securities: A debt security issued by a company or a government, used as a way of raising money. The investor buying the bond is effectively lending money to the issuer of the bond. Bonds offer a return to investors in the form of fixed periodic payments (a ‘coupon’), and the eventual return at maturity of the original amount invested – the par value. Because of their fixed periodic interest payments, they are also often called fixed income instruments, or securities.
ICE BofA Global 300 Convertible Index: A global total return index composed of convertibles issued by companies representative of the market structure of countries in North America, Europe and the Asia/Pacific region, denominated in their local currencies.
Share buybacks: Where a company buys back their own shares from the market, thereby reducing the number of shares in circulation, with a consequent increase in the value of each remaining share. It increases the stake that existing shareholders have in the company, including the amount due from any future dividend payments. It typically signals the company’s optimism about the future and a possible undervaluation of the company’s equity.
Yield curve: A graph that plots the yields of similar quality bonds against their maturities, commonly used as an indicator of investors’ expectations about a country’s economic direction. In normal conditions, you can expect to see a normal/upward sloping yield curve, where yields for shorter-maturity bonds are lower than yields for bonds with a longer maturity. The shape of the yield curve can vary significantly, depending on where investors expect yields to trend in future.
These are the views of the author at the time of publication and may differ from the views of other individuals/teams at Janus Henderson Investors. References made to individual securities do not constitute a recommendation to buy, sell or hold any security, investment strategy or market sector, and should not be assumed to be profitable. Janus Henderson Investors, its affiliated advisor, or its employees, may have a position in the securities mentioned.
Past performance does not predict future returns. The value of an investment and the income from it can fall as well as rise and you may not get back the amount originally invested.
The information in this article does not qualify as an investment recommendation.
There is no guarantee that past trends will continue, or forecasts will be realised.
Marketing Communication.