An options-implied analysis of the U.S. presidential election
Head of Asset Allocation Ashwin Alankar and Chief Investment Strategist Myron Scholes explain how signals within options markets can expose a divergence from the consensus view on the U.S. election, showing even chances between the two parties in contrast to polling data that tend to favor Trump.


4 minute read
Key takeaways:
- Signals embedded within options markets that have long predicted a Biden victory now show even chances between the two presumptive nominees.
- U.S. policy has tremendous global sway in economic and geopolitical matters, so gaining insights into possible election outcomes should be a priority for investors.
- As evidenced by Trump’s trial and Biden’s debate performance, this tight race could hinge on unanticipated events – good reason to continue referencing options markets to gauge investors’ expectations on the election’s outcome.
Watch for another installment on options market signals as the election cycle progresses.
It’s election season, globally, with roughly half the world’s population heading to the polls in 2024. India has already held a significant vote, France is in the midst of snap elections, and the UK is not far behind. Despite a busy few months, it’s still the U.S. presidential and congressional races that dominate the political calendar. As the country with the world’s largest economy and most geopolitical sway, any changes in America’s policy path can have significant ramifications both domestically and beyond its shores.
With so much at stake – along with the length of the U.S. campaign season – news outlets are awash in polling data and pundits attempting to handicap November’s outcome. An underappreciated resource for this endeavor is options markets. Given how options are deployed to hedge risk and maximize returns, these forward-looking instruments can reveal insights that often differ from consensus.
Who benefits from whom?
To glean these insights, we turn to two baskets of stocks created by research firm Strategas – one composed of companies that have historically performed well under Democratic administrations and the other that tends to outperform when Republicans hold the White House. We then measure signals embedded within the options prices of the stocks in these underlying baskets. Derived from Janus Henderson’s proprietary technology, these signals gauge the expected upside and downside volatility of the baskets. We call the ratio of these two measures the tail-Sharpe ratio, as it estimates what is more likely – a “tail-event” upside surprise or a “tail-event” downside surprise.
The prevailing values of these stock baskets would then reflect the option market’s consensus expectation for the election’s outcome. If options markets viewed one of the baskets as more attractive than the other – i.e. either the Republican or Democrat basket had more upside-to-downside potential based on options signals – it would indicate an expectation for that party to win the election.
What we are seeing
As illustrated in Exhibit 1, divergence from the consensus is what options markets are seeing. The chart shows the relationship between the Democrat and Republican tail-Sharpe ratios, with a positive figure suggesting greater upside for the Democrat basket, zero signaling even attractiveness, and a negative reading favoring upside for Republicans.
Exhibit 1: Relationship to Democrat-to-Republican tail-Sharpe ratios
Options-based expectations for a Democrat victory in November have greatly diminished.
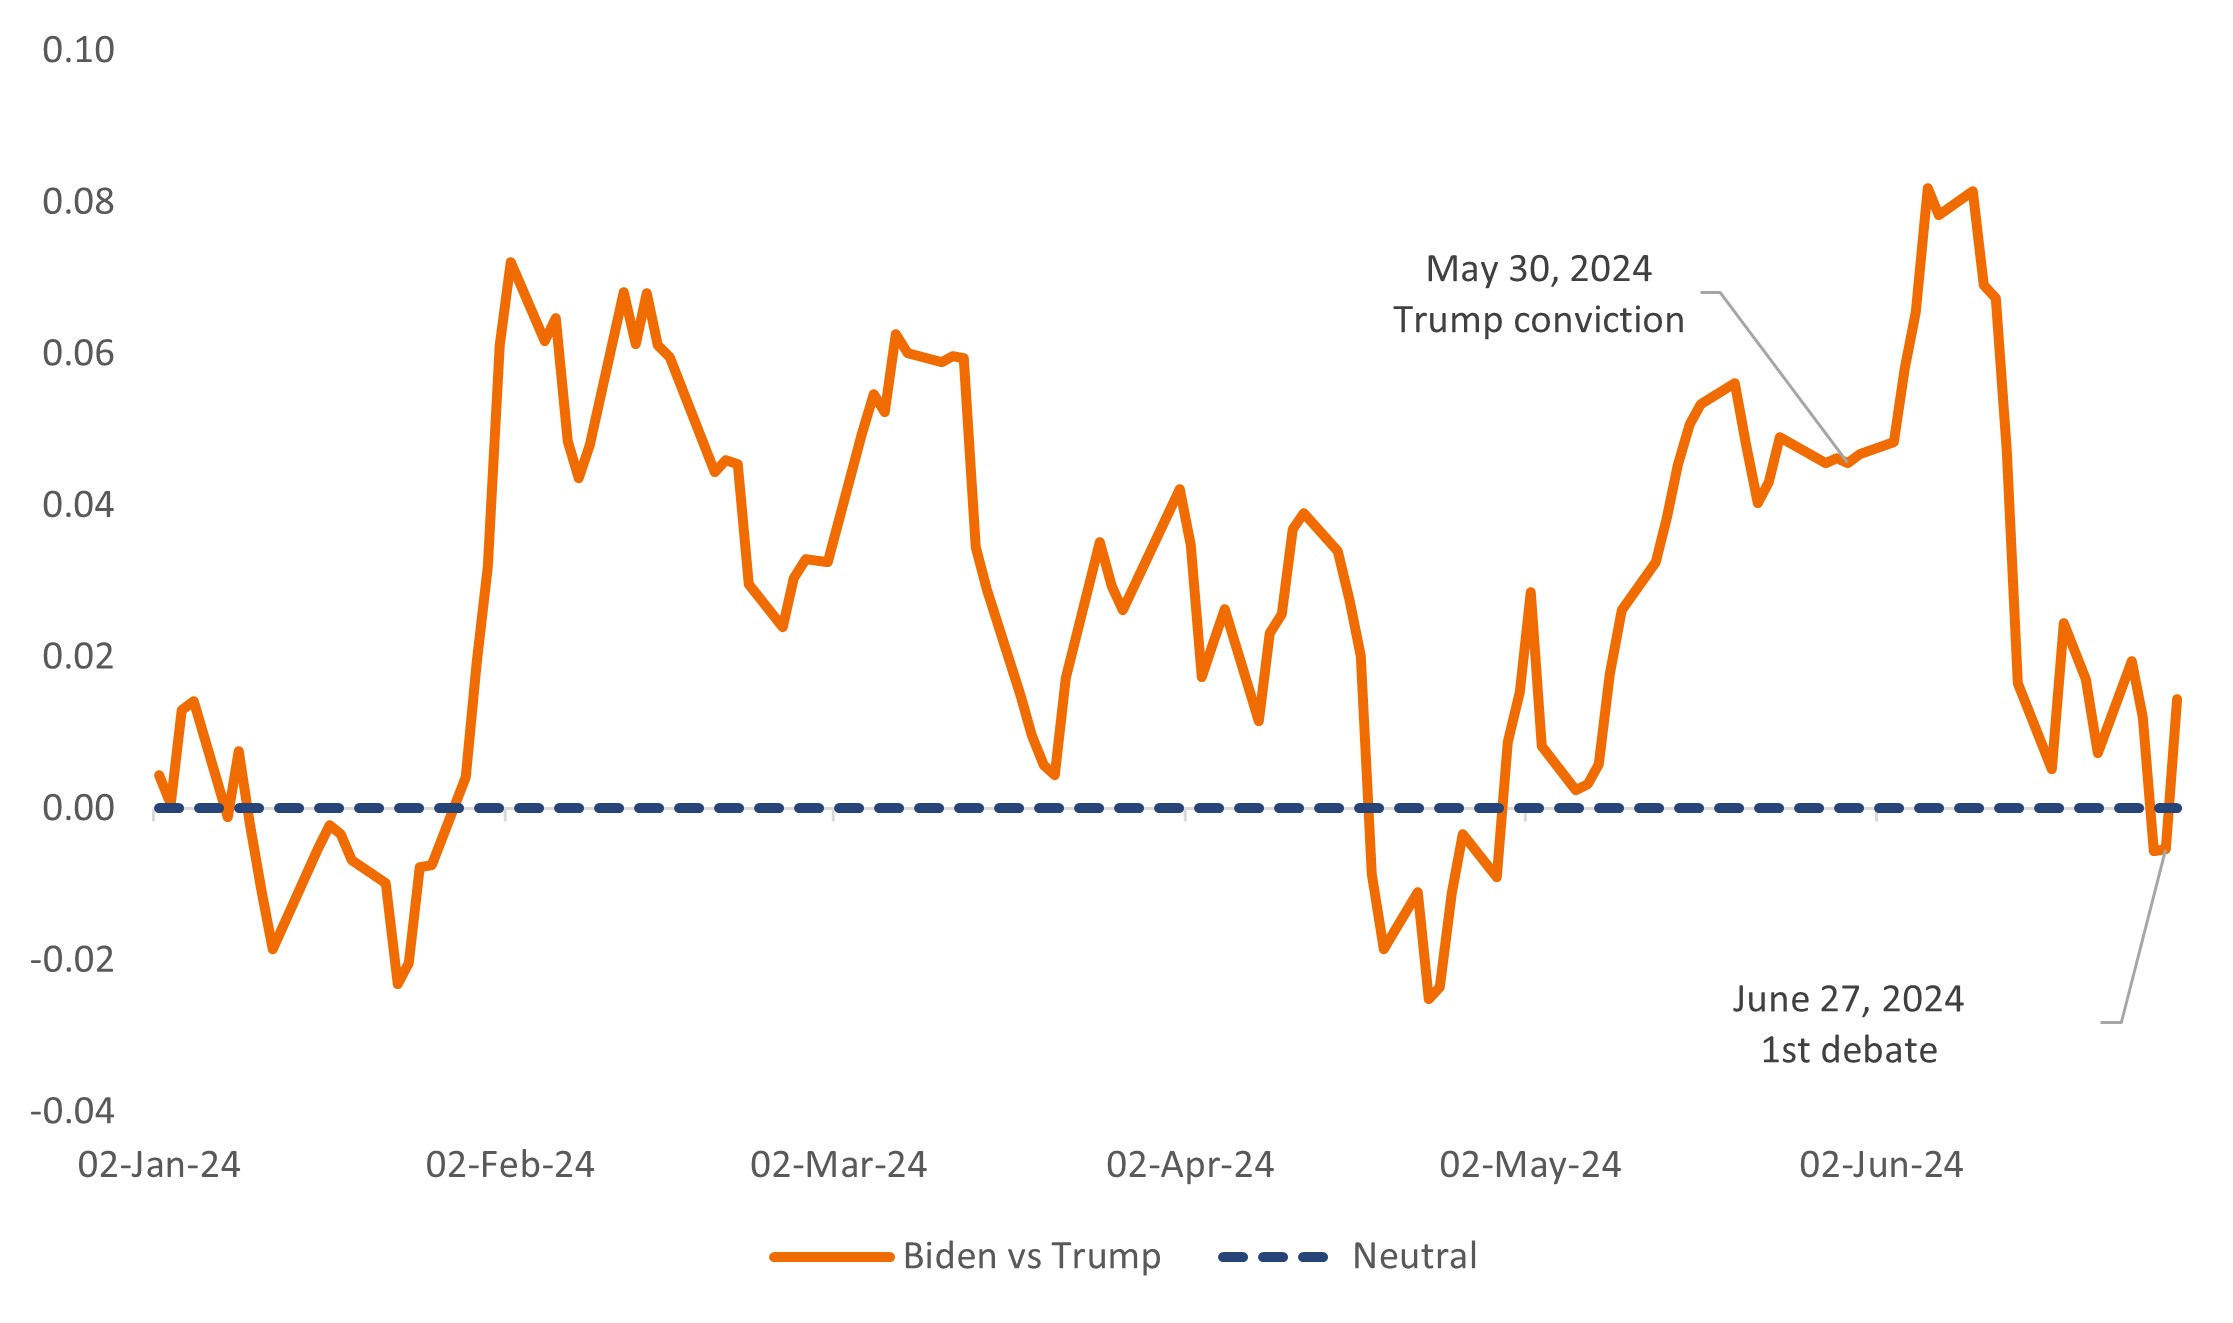 Source: Strategas, Janus Henderson Investors, as of 1 July 2024.
For much of the year, in contrast to national polling data that favored Trump, options signals consistently indicated a Biden victory. Trump’s May conviction only strengthened this view. In the wake of what was widely considered a subpar performance by President Biden in last week’s debate, however, options markets now signal roughly even odds between the two candidates. As illustrated in Exhibit 2, this market-derived view still diverges from the “consensus view” represented by national polling data, which show Trump’s lead increasing.
Exhibit 2: Real Clear Politics national polling data average
The consistency of Trump’s polling lead over President Biden is what gives options markets the opportunity to signal a potential outcome contrary to the consensus view.
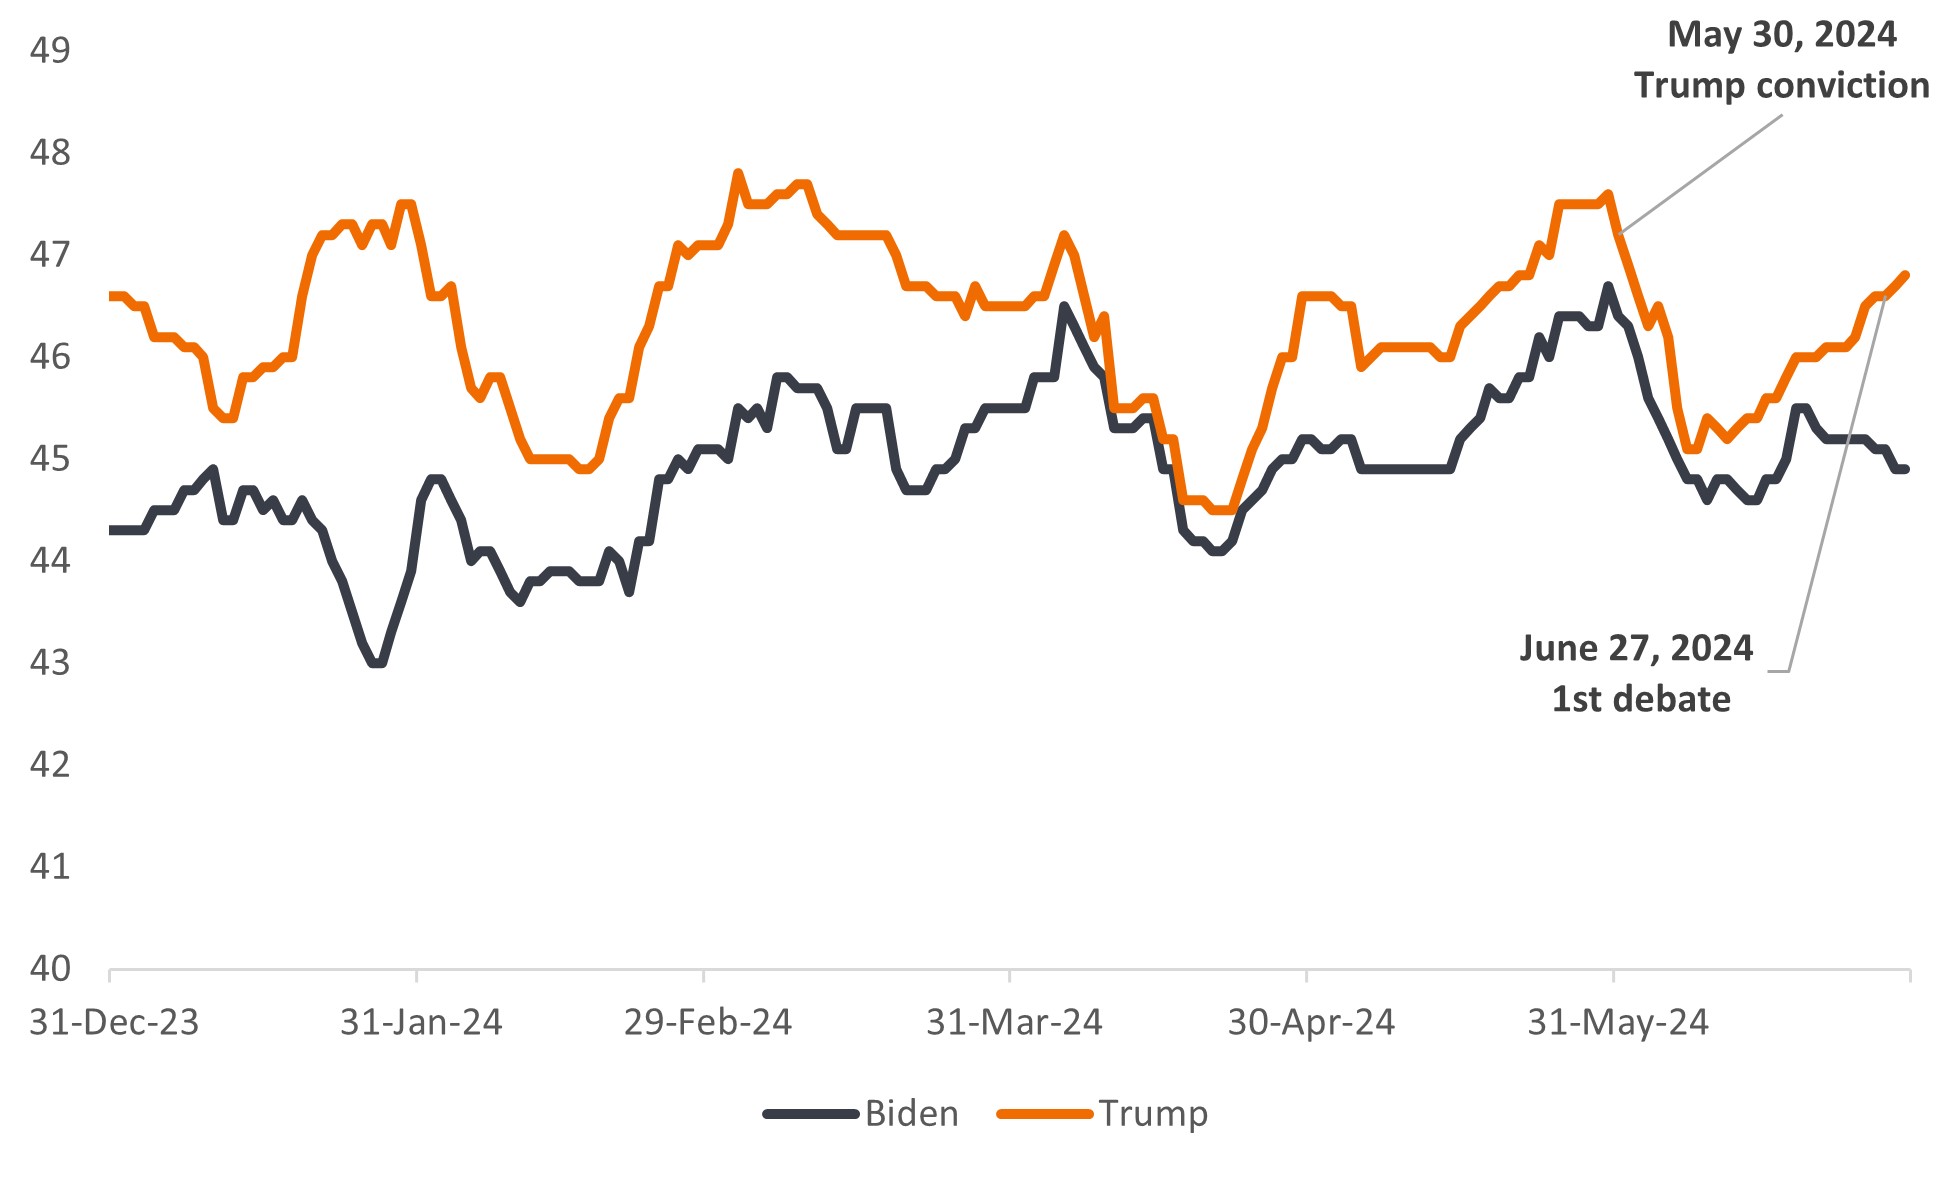 Source: Real Clear Politics, as of 1 July 2024.
October – or convention – surprises?
Notably, options data are currently gauging the strength of the two baskets based on top of the ticket as comprised. There has been conjecture in recent days about whether Biden should continue on as the Democratic candidate. Trump, meanwhile, faces additional court dates. Given the forward-looking nature of options, any future developments in the campaign would be immediately reflected in options prices. As is presently the case, these signals could diverge – and diverge considerably – from consensus views.
It has already been an eventful campaign, and one must be prepared for future twists and turns. Even with the recent developments, options markets continue to expect an extremely tight race. The Janus Henderson Asset Allocation team will continue to monitor this close – and heated – election through the conventions and other developments that may further influence the options market’s expectations.
With the noise of competing news sources, social media, and likely billions of dollars in campaign ads, the options market, in our view, represents a unique lens through which to view the prospects of future U.S. policy.
IMPORTANT INFORMATION
Sharpe Ratio measures risk-adjusted performance using excess returns versus the “risk-free” rate and the volatility of those returns. A higher ratio means better return per unit of risk.
Volatility measures risk using the dispersion of returns for a given investment.
These are the views of the author at the time of publication and may differ from the views of other individuals/teams at Janus Henderson Investors. References made to individual securities do not constitute a recommendation to buy, sell or hold any security, investment strategy or market sector, and should not be assumed to be profitable. Janus Henderson Investors, its affiliated advisor, or its employees, may have a position in the securities mentioned.
Past performance does not predict future returns. The value of an investment and the income from it can fall as well as rise and you may not get back the amount originally invested.
The information in this article does not qualify as an investment recommendation.
There is no guarantee that past trends will continue, or forecasts will be realised.
Marketing Communication.
4 minute read
Key takeaways:
- Signals embedded within options markets that have long predicted a Biden victory now show even chances between the two presumptive nominees.
- U.S. policy has tremendous global sway in economic and geopolitical matters, so gaining insights into possible election outcomes should be a priority for investors.
- As evidenced by Trump’s trial and Biden’s debate performance, this tight race could hinge on unanticipated events – good reason to continue referencing options markets to gauge investors’ expectations on the election’s outcome.
Related insights

Watch for another installment on options market signals as the election cycle progresses.
It’s election season, globally, with roughly half the world’s population heading to the polls in 2024. India has already held a significant vote, France is in the midst of snap elections, and the UK is not far behind. Despite a busy few months, it’s still the U.S. presidential and congressional races that dominate the political calendar. As the country with the world’s largest economy and most geopolitical sway, any changes in America’s policy path can have significant ramifications both domestically and beyond its shores.
With so much at stake – along with the length of the U.S. campaign season – news outlets are awash in polling data and pundits attempting to handicap November’s outcome. An underappreciated resource for this endeavor is options markets. Given how options are deployed to hedge risk and maximize returns, these forward-looking instruments can reveal insights that often differ from consensus.
Who benefits from whom?
To glean these insights, we turn to two baskets of stocks created by research firm Strategas – one composed of companies that have historically performed well under Democratic administrations and the other that tends to outperform when Republicans hold the White House. We then measure signals embedded within the options prices of the stocks in these underlying baskets. Derived from Janus Henderson’s proprietary technology, these signals gauge the expected upside and downside volatility of the baskets. We call the ratio of these two measures the tail-Sharpe ratio, as it estimates what is more likely – a “tail-event” upside surprise or a “tail-event” downside surprise.
The prevailing values of these stock baskets would then reflect the option market’s consensus expectation for the election’s outcome. If options markets viewed one of the baskets as more attractive than the other – i.e. either the Republican or Democrat basket had more upside-to-downside potential based on options signals – it would indicate an expectation for that party to win the election.
What we are seeing
As illustrated in Exhibit 1, divergence from the consensus is what options markets are seeing. The chart shows the relationship between the Democrat and Republican tail-Sharpe ratios, with a positive figure suggesting greater upside for the Democrat basket, zero signaling even attractiveness, and a negative reading favoring upside for Republicans.
Exhibit 1: Relationship to Democrat-to-Republican tail-Sharpe ratios
Options-based expectations for a Democrat victory in November have greatly diminished.
Source: Strategas, Janus Henderson Investors, as of 1 July 2024.
For much of the year, in contrast to national polling data that favored Trump, options signals consistently indicated a Biden victory. Trump’s May conviction only strengthened this view. In the wake of what was widely considered a subpar performance by President Biden in last week’s debate, however, options markets now signal roughly even odds between the two candidates. As illustrated in Exhibit 2, this market-derived view still diverges from the “consensus view” represented by national polling data, which show Trump’s lead increasing.
Exhibit 2: Real Clear Politics national polling data average
The consistency of Trump’s polling lead over President Biden is what gives options markets the opportunity to signal a potential outcome contrary to the consensus view.
Source: Real Clear Politics, as of 1 July 2024.
October – or convention – surprises?
Notably, options data are currently gauging the strength of the two baskets based on top of the ticket as comprised. There has been conjecture in recent days about whether Biden should continue on as the Democratic candidate. Trump, meanwhile, faces additional court dates. Given the forward-looking nature of options, any future developments in the campaign would be immediately reflected in options prices. As is presently the case, these signals could diverge – and diverge considerably – from consensus views.
It has already been an eventful campaign, and one must be prepared for future twists and turns. Even with the recent developments, options markets continue to expect an extremely tight race. The Janus Henderson Asset Allocation team will continue to monitor this close – and heated – election through the conventions and other developments that may further influence the options market’s expectations.
With the noise of competing news sources, social media, and likely billions of dollars in campaign ads, the options market, in our view, represents a unique lens through which to view the prospects of future U.S. policy.
IMPORTANT INFORMATION
Sharpe Ratio measures risk-adjusted performance using excess returns versus the “risk-free” rate and the volatility of those returns. A higher ratio means better return per unit of risk.
Volatility measures risk using the dispersion of returns for a given investment.