Subscribe
Sign up for timely perspectives delivered to your inbox.
As market dynamics shift and mega-cap tech companies show vulnerability, Portfolio Manager Nick Sheridan explores how global small caps, with their unique growth and diversification potential, are poised for a significant resurgence.

How do small caps solve their image problem? In an era of MAG 7 ‘mega cap’ tech dominance, global small caps have struggled to maintain their visibility, with endless headlines focused on macro-level major themes – like artificial intelligence (AI) – capturing investors’ attention and leading to ever-higher multiples for a heavily hyped shortlist of names.
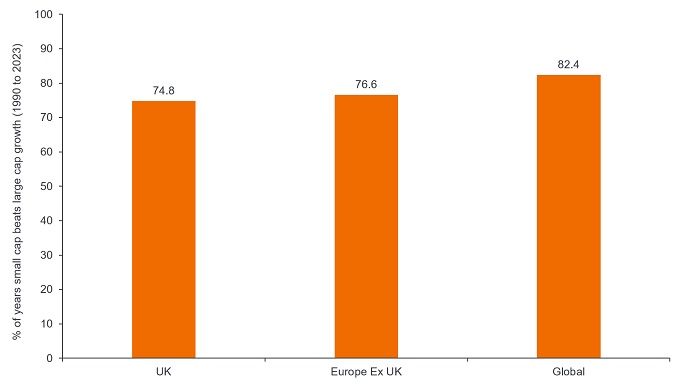
In this environment, small cap stocks have struggled, in terms of performance, relative to large caps. But these kinds of market cycles are nothing new. While this latest cycle of large-cap outperformance has endured, there have been many more periods where small cap stocks have outshone their larger peers, led by consistently higher earnings growth (Exhibit 1).

Source: JPMorgan research, Janus Henderson Investors Analysis, as at 31 December 2023. Growth here measured by growth in EBITDA – Earnings before Interest Tax Depreciation and Amortisation. Past performance does not predict future returns.
For the past few years, mega-cap tech stocks have carried the stock market on their shoulders, but 2024 has seen some cracks finally appear in the profile for these stocks, where even strong growth has not been enough to satisfy the rapacious expectations of the market. This has left investors starting to look elsewhere for value.
As we move further past the peak of the interest rate cycle, and central banks continue to cut rates in pursuit of a ‘soft landing’ scenario, we see potential for investors to continue recalibrating their portfolios towards areas of the market that have historically tended to benefit the most from lower interest rates – small cap stocks.
Outside of macro trends, the key to small cap outperformance is the capacity they have to grow their earnings in a way that large cap stocks will struggle to consistently match. It is hard for a company like Apple to deliver significant growth on US$400 billion of annual sales, given its existing penetration. It is much easier for a small business to grow its sales by expanding into new markets, acquiring new clients, or broadening its product range.
There is also a case for investors to use small caps as a diversifier, given the clear structural differences that differentiate the small cap sector from their large cap peers. Small caps tend to operate more in industrials or materials than technology and are generally more focused on local markets. This means that an allocation to small caps leaves investors exposed to different structural drivers, such as de-globalisation (ie. the rebuilding of domestic production lines, rather than outsourcing to places like China).
But that does not mean that these sectors are not also participating in global mega trends, supplying the parts, products or raw materials that fast-evolving technology needs to sustain its growth. There are plenty of small cap stocks tapping into the huge long-term structural capex cycle for major technology firms, rather than relying on the variables of consumer demand.
The ‘evergreen’ argument for allocating to small caps is the persistent tailwind of merger and acquisition (M&A) activity. While the split can differ between regions, the vast majority of all M&A includes involves the acquisition of small cap businesses by a larger rival (Exhibit 2). Big companies buying small ones – often at a real premium to the prevailing price.

Source: Bloomberg, Factset, JPMorgan calculations, Janus Henderson Investors Analysis, as at 30 September 2024. Stocks below US$100m market cap excluded.
Ultimately small caps remain unloved and out of favour, but we see a lot of pent-up demand, with investors still lacking a bit of confidence in the economy – more so in Europe and the UK than in the US.
Smaller companies in the UK have had a tough time over the past few years, with uncertainty around Brexit compounded by rising interest rates costs and higher corporation tax rates. We see 2024 as a transformative period, and UK small caps are arguably no longer the ugly duckling. Growth in the economy is stirring, inflation is under control and we have a new government with a clear mandate for growth. Balance sheets are strong and we see lots of smaller companies with a net cash position (45% as at 30 September 2024).
Anecdotally, we are also seeing M&A interest picking up, primarily driven by overseas and private equity investors. But alongside that we are seeing a lot of buyback interest, as companies start to recognise their own value, rather than being just ripe targets for buyouts from their larger peers.
Europe might have the perception of being sclerotic, arguably even boring, but that overlooks that European small caps arguably have the most latent potential at a regional level. Europe is home to many fantastic companies that are exposed to any structural growth theme you can name. Companies with products or materials that are in consistent demand, or with scarce assets or a particular expertise that means they get paid whatever happens in the market.
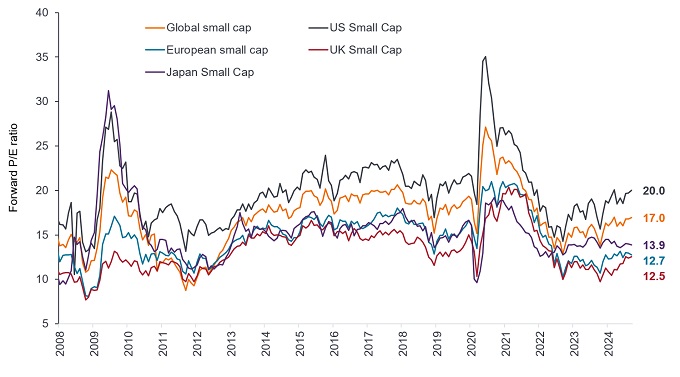
While we have focused here on the UK and Europe, the global story is no different. US small cap stocks have shown signs of renewed momentum since mid-July 2024, initially sparked by anticipation of US Federal Reserve rate cuts, which duly followed. The argument now is if small caps might be on the cusp of an extended rotation. We see plenty of potential for additive stock selection across the global small cap space, given current prices (Exhibit 3).

Source: DataStream, MSCI regional small cap indices, Janus Henderson Investors Analysis, as at 30 September 2024. The forward price-to-earnings (forward P/E) ratio is a version of the ratio of price-to-earnings (P/E) that is calculated using forecasted earnings. There is no guarantee that past trends will continue, or forecasts will be realised. Past performance does not predict future returns.
The key thing to keep in mind with small caps is the fact that companies in this space often get very little research coverage, despite it being a huge universe. You can find cash-generative, profitable companies with a long track record, that are the dominant player in what are often niche – but essential – industries. And yet many investors do not know what they do.
Investors might have to work a little harder to find companies that have the potential to deliver, but identifying a quality growth company generating a high return on capital that has been overlooked by the market, or finding a catalyst for change, such as a new CEO with a clear plan to revolutionise a business, can be transformative to your investment outcome.
Ultimately, valuation matters. The price that you pay at the beginning of the life cycle of owning an asset is fundamental to determining the return that you make. And at the moment, valuations across the small cap universe arguably offer plenty to consider, both relative to history and relative to the large cap universe. We think that should be a core message for investors at this point in the cycle.
Balance sheet: A financial statement that summarises a company’s assets, liabilities and shareholders’ equity at a particular point in time. Each segment gives investors an idea as to what the company owns and owes, as well as the amount invested by shareholders. It is called a balance sheet because of the accounting equation: assets = liabilities + shareholders’ equity.
Buyback: Where a company buys back their own shares from the market, thereby reducing the number of shares in circulation, with a consequent increase in the value of each remaining share. It increases the stake that existing shareholders have in the company, including the amount due from any future dividend payments. It typically signals the company’s optimism about the future and a possible undervaluation of the company’s equity.
Capital expenditure (Capex): Money invested to acquire or upgrade fixed assets such as buildings, machinery, equipment or vehicles in order to maintain or improve operations and foster future growth.
Diversification: A way of spreading risk by mixing different types of assets/asset classes in a portfolio, on the assumption that these assets will behave differently in any given scenario. Assets with low correlation should provide the most diversification.
EBITDA: Earnings before interest, tax, depreciation and amortisation (EBITDA) is a metric used to measure a company’s profitability net of expenses and associated costs, taxes or debts.
Inflation: The rate at which the prices of goods and services are rising in an economy. The Consumer Price Index (CPI) and Retail Price Index (RPI) are two common measures.
Interest rate cycle: The rise and fall of interest rates over time.
MAG7: Alphabet, Amazon, Apple, Meta, Microsoft, Nvidia, and Tesla – seven major technology firms collectively known as the Magnificent Seven.
Mega caps: The largest designation for companies in terms of market capitalisation. Companies with a valuation (market capitalisation) above $200 billion in the US are considered mega caps. These tend to be major, highly recognisable companies with international exposure, often comprising a significant weighting in an index.
Small caps: Companies with a valuation (market capitalisation) within a certain scale, eg. $300 million to $2 billion in the US, although these measures are generally an estimate. Small cap stocks tend to offer the potential for faster growth than their larger peers, but with greater volatility.
Macro: Large-scale factors related to the economy, such as inflation, unemployment or productivity.
Private equity: An investment in a company that is not listed on a stock exchange. It tends to involve investors committing large amounts of money for long periods of time.
Return on capital: A measure of a company’s return on its spending. A higher return on capital generally indicates that a management team is more efficient at generating revenues from investment.