Subscribe
Sign up for timely perspectives delivered to your inbox.
The net zero transition has offered investors long-term returns potential. Here we explore the importance of evaluating transition plans in identifying both market risks and opportunities.

As countries and companies commit to limiting global temperature rise to 1.5°C by decarbonising the global economy by 2050 the net zero transition poses both risks and opportunities. Here we explore the importance of evaluating the credibility of corporate transition plans across key industries. This was the subject of a recent debate hosted by our Chief Responsibility Officer, Michelle Dunstan, alongside a panel of experts for the recent Janus Henderson ‘Beyond Carbon: Investing in a credible climate transition to drive real-world change’ webcast.
Evaluating the credibility of transition plans is far from straightforward, explained Adrienn Sarandi, Global Head of ESG Solutions & Strategic Initiatives. However, whilst there isn’t an internationally agreed definition of a credible transition plan, there are similarities across various frameworks and regions on the key areas to focus on.
Essentially, a credible transition plan must explain how a company is going to deliver on its net zero commitment and what the dependencies are that underpin the implementation of the climate strategy. Credible science-based targets and commitments need to be backed up by a detailed action plan, accountability to deliver those ambitions, and reporting on progress needs to be clear and transparent.
“Investors understand the importance of long-term climate transition planning,” noted Adrienn. “However, the challenging thing about evaluating climate transition plans is how do you really know who’s got a credible transition plan? And how do you know who the leaders and the laggards in a sectoral and regional context are?”
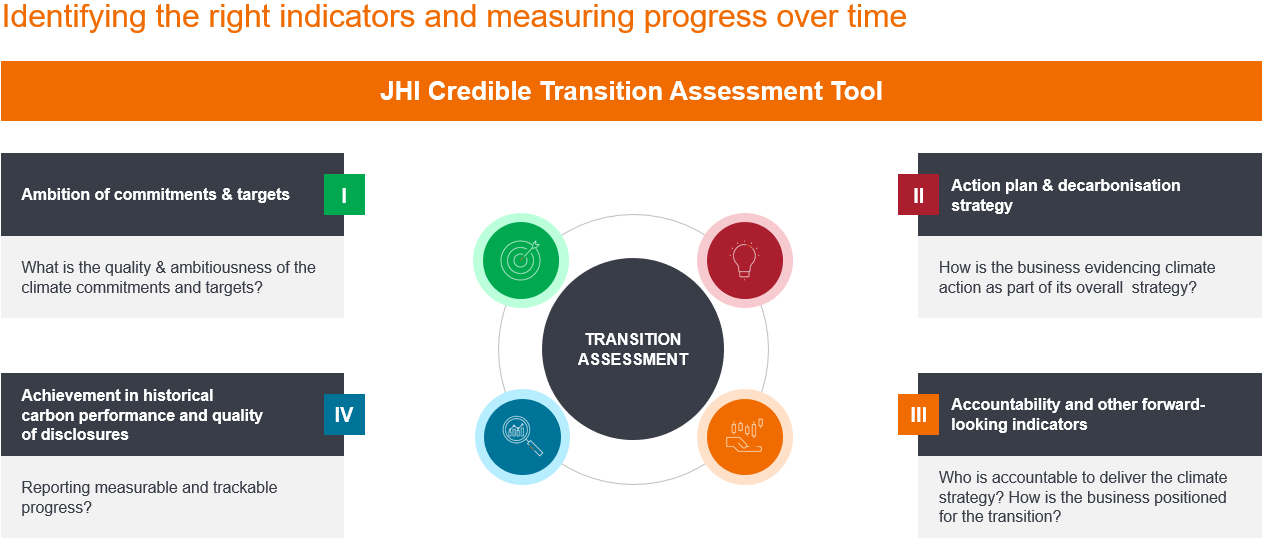
To address these challenges, Janus Henderson has developed an internal framework that leverages data, research, and active stewardship, as well as a proprietary Credible Transition Assessment tool (Exhibit 1) that includes over 110 indicators and signals to “dig deep into the detail” behind companies’ commitments, targets, historical carbon performance drivers and action plans to deliver their climate commitments as part of the wider business strategy.
Exhibit 1: Data driven evaluation

Source: JHI Methodology; data sources include company reports, MSCI ESG Manager, TPI, SBTi, CDP, Bloomberg.
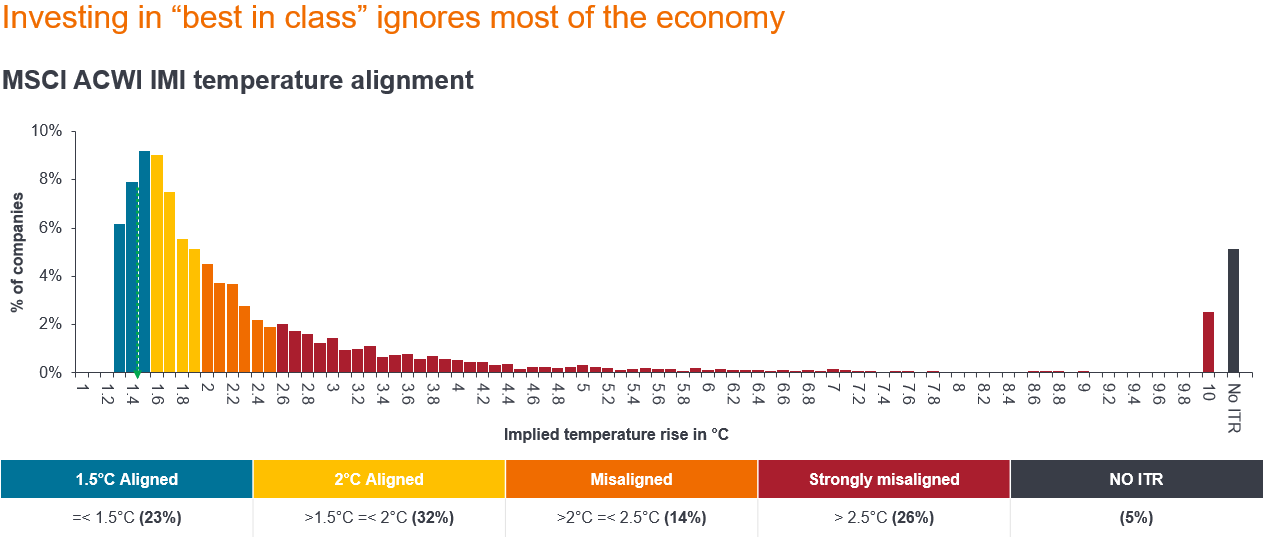
Further, as shown in Exhibit 2, in a 1.5°C scenario the investible universe is extremely limited, with very few companies aligned to a limiting a global temperature rise at that level. “By only investing in low carbon ‘best in class’ companies, investors risk ignoring most of the real economy, foregoing the opportunity to drive real world change through engagement, and creating a skewed portfolio by investing in just a handful of sectors,” according to Michelle.
Exhibit 2: Few companies align to a 1.5°C scenario today

Source: MCSI ESG Manager, as of 30 April 2024, MSCI All Country World Index Investable Markets Index (ACWI IMI), n=8,911 companies, Market Cap US$107 trillion.
The importance of effectively evaluating companies’ transition plans comes down to one key word – “opportunity”, according to Senior Investment Manager in the Global Sustainable Equity Team, Tal Lomnitzer.
“This refers to the opportunity to make a positive contribution to the much-needed energy transition,” noted Tal. “We’re talking about a broad set of attractive long-term growth opportunities as the world’s energy, industrial, transportation, production, and consumption systems transition to a low carbon economy.”
To achieve the net zero transition requires a large level of investment, encouraged by a mixture of sticks, including carbon taxes and a phasing out of fossil fuel subsidies, and carrots, such as incentives for renewable energy expansion. These levers are encouraging economic actors to reduce energy-related greenhouse gas emissions (GHG).
As shown in Exhibit 3, a lot of money is forecast to flow towards addressing climate change – an expected US$140 trillion by 2050. That investment spans a range of opportunities, primarily across clean energy and other associated infrastructure.
Exhibit 3: The opportunity is large…

Source: IEA World Energy Investment 2020, UBS Research
“On the risk side, there are going to be certain companies that just can’t make the shift, leaving them at risk of having stranded assets, missing earnings projections, losing market share and ultimately leading to poor shareholder returns,” said Tal.
Striking the right balance between risk and opportunity is vital, especially when there is rising interest among investors for exposure to this area of the market, with European sustainable funds attracting US$10.9 billion in Q1 – more than doubling the previous quarter, according to data and analytics provider Morningstar.3
As explored in a recent energy transition article, Tal identified three types of companies that play a key role in making the climate transition a reality:
Green solutions: Companies with revenue exposure to clean energy deployment or low emission operations, such as wind turbines, solar panels, semiconductors used in clean tech or electric vehicles, providers of renewable or efficiency technology.
Enablers: Providers of low-carbon critical commodities like copper or lithium, financers of low carbon or clean energy deployment, computer aided design (CAD) software or engineering services to design industrial plant, semiconductors, providers of precision farming equipment or plant-based proteins for reducing the environmental footprint of feeding the growing world population.
Improvers: ‘Brown to green’ – companies that provide essential goods and services like auto makers, aviation companies, electricity utilities, oil and gas producers, steel producers, or cement makers but are trying to do so with a lower carbon impact.
Within the green solutions category, manufacturers of wind turbineshave strong tailwinds. Offshore wind generation in Europe alone is set to rise from 30 gigawatts (GW) in 2023 to 60 GW by the end of the decade. That figure is forecast to climb to anywhere between 300-500 GW in 2050, representing a tenfold growth in offshore wind generation in the region.4
Further, investment is mobilising into onshore and offshore wind generation through various initiatives, including €300 billion (US$322.6 billion) REPowerEU5 – a plan to end reliance on Russian fossil fuels before 2030 in response to the war in Ukraine – as well as US$360 billion from the US Inflation Reduction Act, which is extending the runway for tax credits for companies operating in the industry.6
For companies in this sector, these tailwinds potentially create an opportunity, according to Tal, at a time when a combination of headwinds, including irrational pricing from competitors, cost inflation, a slowdown in the industry due to permitting delays and rising financing costs, are dissipating.
Within the enablers category, which encompasses companies involved in the supply chain that allow green solutions to exist and be deployed, Tal noted the essential role of commodities like copper. The metal is vital in advancing electrification – the replacement of technologies or processes that use fossil fuels, like internal combustion engines and gas boilers, with electrically-powered equivalents, such as electric vehicles or heat pumps.
He pointed to a Canada-based company that recently made one of the largest, highest grade copper discoveries of the past 30 years in the Democratic Republic of Congo, as an example of a key player within this category.
“It’s a real success story in an industry that has historically struggled to deliver projects, on time and on budget,” said Tal, adding that it also has produced some of the lowest carbon footprint copper on the planet due to the company using hydropower generated from the waters of the Congo River to power its processing operations.
Companies within the improvers category typically have a significant carbon footprint but are actively working to improve their business to align with a net zero future. Further, we believe it is imperative for both investors and members of the fossil fuel industry to pivot towards strategies that minimise transition risk and drive innovation for a viable energy future.
“The bottom line is we need to facilitate the transition, while keeping the world spinning. If we stop oil production today, we’re going to quickly face a huge hit to global economies,” said Tal, adding that we lose the chance to drive real change by only investing in climate leaders.
Leveraging our insights from our research to find companies within hard-to-abate sectors like oil and gas that are truly committed to change, and then engaging with them to establish credible transition plans that enable them to better prepare for the future is far better than the divestment route, he added.
Research Analyst Noah Barrett also argues that this is an area of the market where the most meaningful rate of change stories are currently occurring.
A standout example within the improver category, according to Noah, is a French oil and gas company, which has a presence in both upstream and downstream operations.
“The company’s absolute carbon footprint can be viewed as a challenge, but its scale also represents a significant advantage in the transition, because the existing conventional production base generates a significant amount of cash flow, which can be reinvested into lower carbon energies,” said Noah.
Relative to its peers in the oil and gas sector, which tend to rely on divestments or the buying of carbon offset to meet their energy transition goals, the French supermajor has dedicated the highest percentage of capital expenditure to low-carbon business operations.
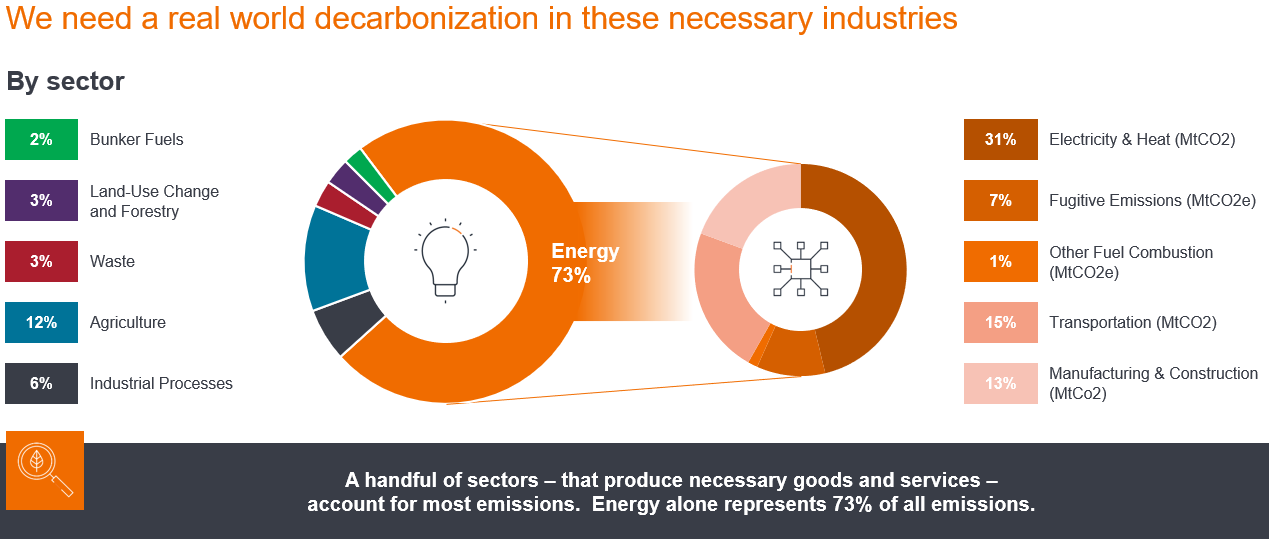
According to Tal, via a mixture of research and engagement, and as shown in Exhibit 4, it is possible to identify key sectors and subsectors that contribute to the climate transition, such as materials, transport, chemicals, finance, technology, oil and gas, utilities, and real estate – “they’re all a part of that mosaic”.
Exhibit 4: We can’t ignore the “dirty” sectors

Source: Climatewatchdata.org (World Resources Institute 2024), latest data as of 2020.
“We drill into the companies in great depth seeking to understand their business models and their transition goals, so we take an approach that considers sales, earnings and cash flow growth on a per share basis,” noted Tal.
We undertake in-house analysis of companies’ transition plans in terms of the short-, medium-, and long-term horizons, identifying opportunities for lowering their carbon footprints. rather than just focusing solely on those with the greenest credentials today.
“Our goal here is to generate risk-adjusted returns,” concluded Tal. “By adopting this approach, we believe that investors can make long-term investment returns, while also driving the transition forward.”
Our ESG integration approach: Thoughtful, practical, research-driven and forward-looking
1Source: UK Transition Plan Taskforce, Disclosure Framework
2Source: The International Sustainability Standards Board, IFRS 1 and 2 inaugural standards
3Source: Morningstar, ‘Global Sustainable Fund Flows: Q1 2024 in Review’
4Source: European Commission, Offshore renewable energy
5Source: European Commission, REPowerEU
6Souce: The Conversation, ‘Getting to net zero emissions: How energy leaders envision countering climate change in the future’
7Source: International Energy Agency, ‘After slight rise in 2023, methane emissions from fossil fuels are set to go into decline soon’
Capital expenditure: Money invested to acquire or upgrade fixed assets such as buildings, machinery, equipment or vehicles in order to maintain or improve operations and foster future growth.
ESG: Environmental, Social and Governance (ESG), also known as sustainable investing, considers ethical factors beyond traditional financial analysis.
Free cash flow (FCF): Cash that a company generates after allowing for day-to-day running expenses and capital expenditure. It can then use the cash to make purchases, pay dividends or reduce debt.
Net zero: A state in which greenhouse gases, such as Carbon Dioxide (C02) that contribute to global warming, going into the atmosphere are balanced by their removal out of the atmosphere.
Scope 1 carbon emissions: Direct Green House Gas (GHG) emissions from owned or controlled sources.
Scope 2 carbon emissions: Indirect Green House Gas (GHG) emissions, such as that created through the generation of purchased energy (eg. electricity).
Scope 3 carbon emissions: Associated Green House Gas (GHG) emissions related to the entire value chain of a business that it is indirectly responsible for, from products purchased from suppliers to its own products when consumers use them.
MSCI All Country World Index Investable Markets Index (ACWI IMI): The index captures large, mid and small cap representation across 23 developed markets and 24 emerging markets countries. With 8,847 constituents, the index is comprehensive, covering approximately 99% of the global equity investment opportunity set.
Energy industries can be significantly affected by fluctuations in energy prices and supply and demand of fuels, conservation, the success of exploration projects, and tax and other government regulations.
References made to individual securities do not constitute a recommendation to buy, sell or hold any security, investment strategy or market sector, and should not be assumed to be profitable. Janus Henderson Investors, its affiliated advisor, or its employees, may have a position in the securities mentioned.
There is no guarantee that past trends will continue, or forecasts will be realised.
Past performance does not predict future returns.
The views presented are as of the date published. They are for information purposes only and should not be used or construed as investment, legal or tax advice or as an offer to sell, a solicitation of an offer to buy, or a recommendation to buy, sell or hold any security, investment strategy or market sector. Nothing in this material shall be deemed to be a direct or indirect provision of investment management services specific to any client requirements. Opinions and examples are meant as an illustration of broader themes, are not an indication of trading intent, are subject to change and may not reflect the views of others in the organization. It is not intended to indicate or imply that any illustration/example mentioned is now or was ever held in any portfolio. No forecasts can be guaranteed and there is no guarantee that the information supplied is complete or timely, nor are there any warranties with regard to the results obtained from its use. Janus Henderson Investors is the source of data unless otherwise indicated, and has reasonable belief to rely on information and data sourced from third parties. Past performance does not predict future returns. Investing involves risk, including the possible loss of principal and fluctuation of value.
Janus Henderson is a trademark of Janus Henderson Group plc or one of its subsidiaries. © Janus Henderson Group plc.