Please ensure Javascript is enabled for purposes of website accessibility Multi-Sector Income Fund - Janus Henderson Investors
For Institutional Investors in the US

JMUIX Multi-Sector Income Fund

For investors seeking a steady stream of high income with lower risk than a dedicated high-yield strategy.

NAV
$8.50
As of 07/02/2024

1-Day Change
$0.01 (0.14%)
As of 07/02/2024

YTD Return
2.49%
As of 07/02/2024

Morningstar Rating

As of 05/31/2024

Overview

Fund Highlights

SEEKS HIGH & CURRENT INCOME

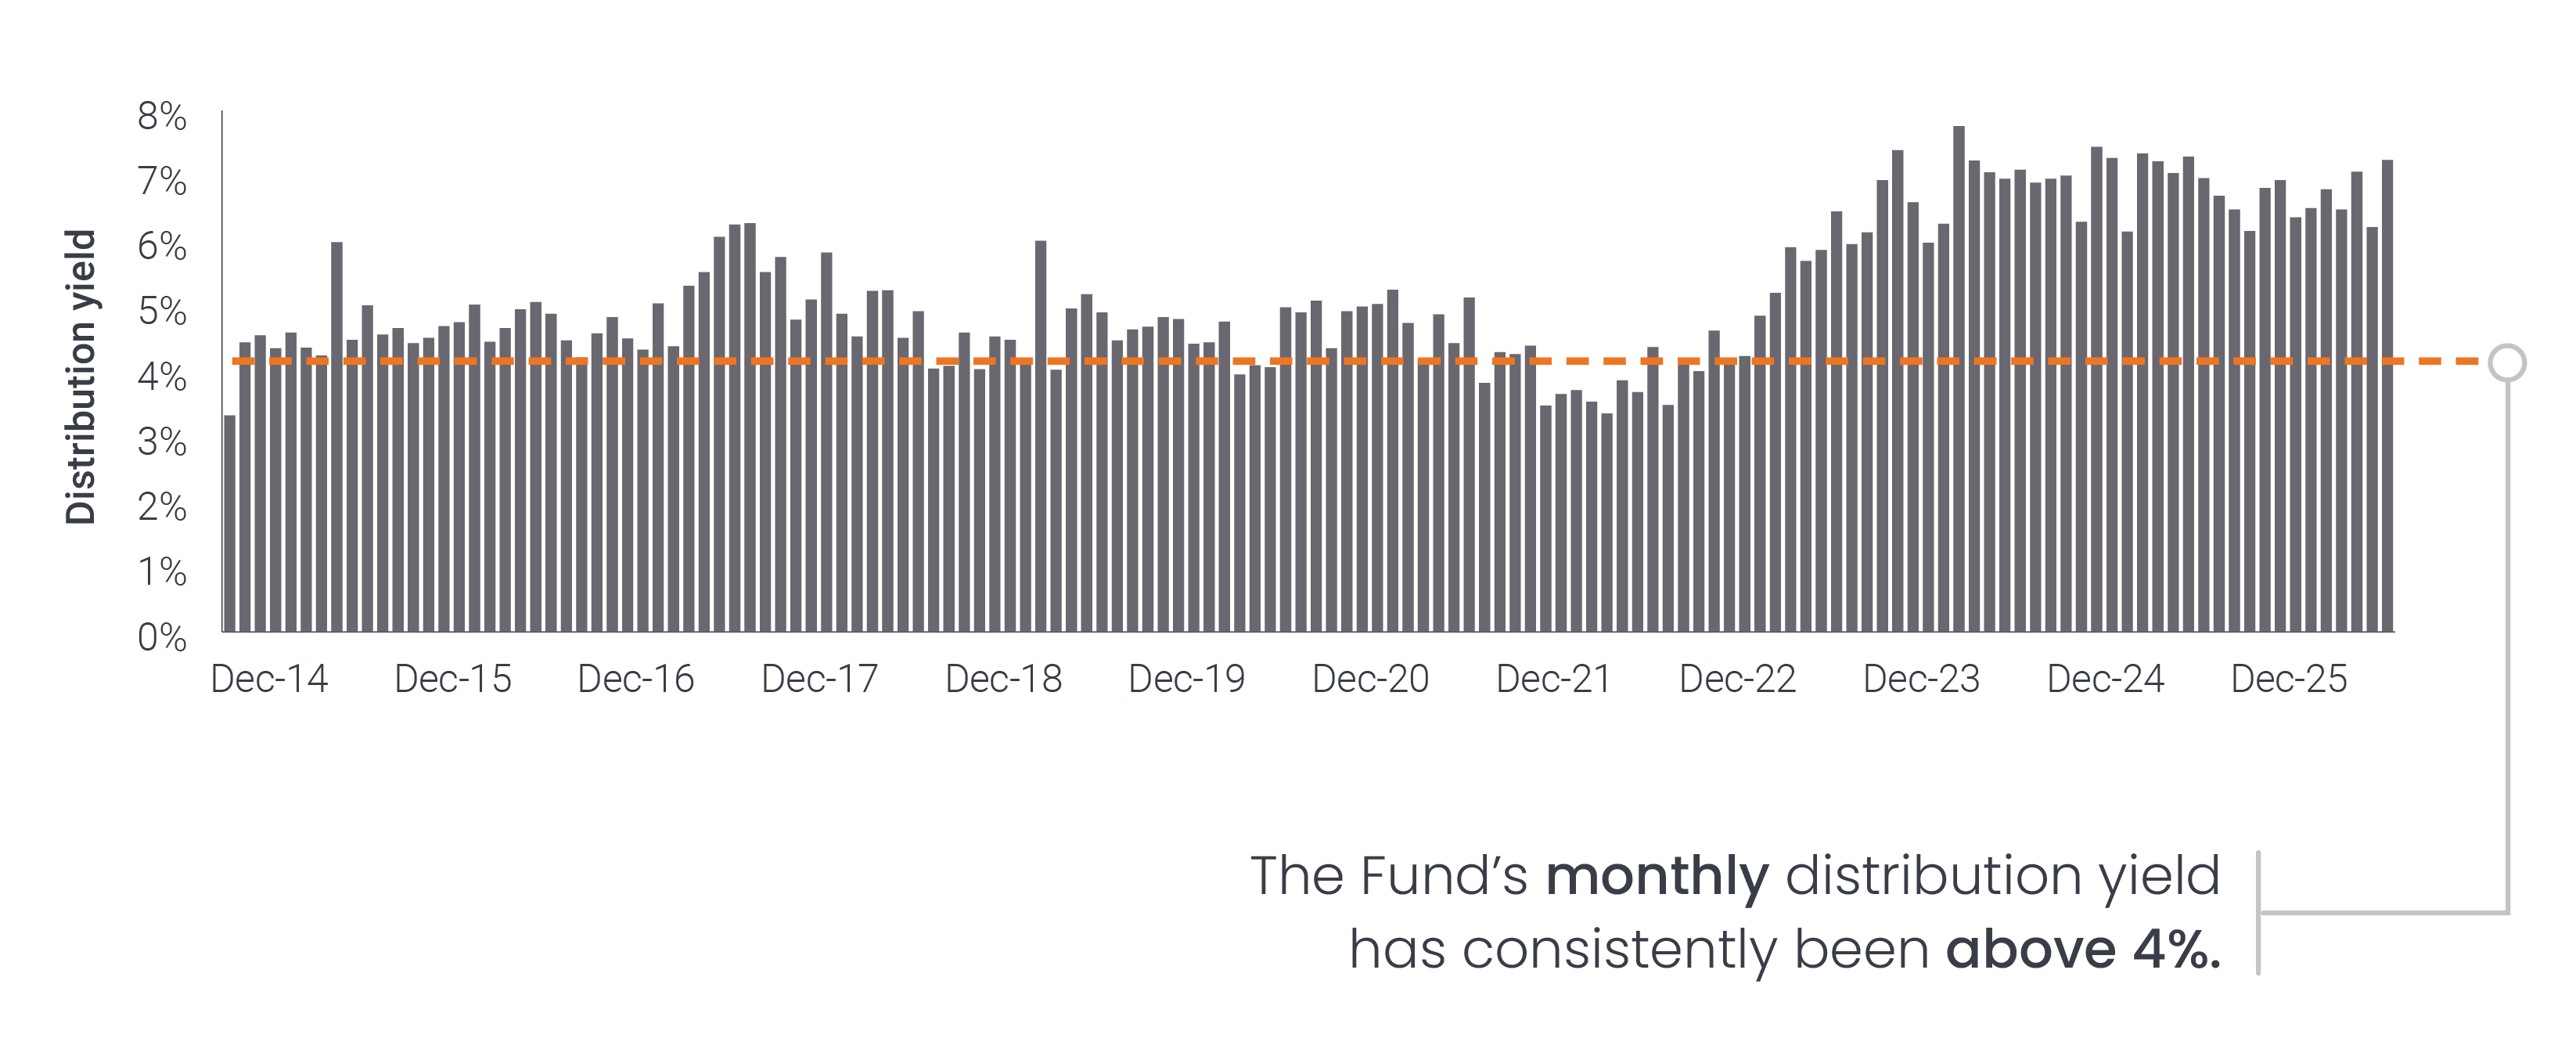
Monthly distribution yield has consistently been above 4%.

DESIGNED TO PERFORM

Actively managed strategy adapts to changing interest rate and credit risk environment.

EXPERIENCED AND SPECIALIZED TEAM

Three portfolio managers with complementary expertise in investment grade, high yield and securitized assets.

In Your Portfolio

InYourPortfolio-Diversified-Fixed-Income

With its exposure to higher-yielding opportunities, the Fund may serve to complement and diversify a core fixed income allocation. It may be suitable for investors looking for a current monthly income stream.

When we add a security to the portfolio, the goal is to do one of two things: either dampen volatility or provide
us with the income that we want. Ideally, it will do both.”

– Seth Meyer, Portfolio Manager

Our Approach

IDENTIFY BEST RISK-ADJUSTED OPPORTUNITIES
Leverages a bottom-up, fundamental, actively managed approach across U.S. fixed income

FUNDS INVEST IN…

Higher yielding sectors seeking higher income – typically holds between 35% and 65% in below investment grade securities

Less volatile sectors and shorter duration securities to help dampen overall volatility and create ballast for the fund

415784r1_ProductPage_Advisor_MultiSectorIncome_DRAFT_3_SectorsGraph

RISK MANAGEMENT

Risk management is fully integrated into the process, with deep, real-time insight gleaned from our proprietary portfolio and risk management system, Quantum Global.

What We Have Achieved

HIGH, CURRENT INCOME WITH:

  • Less interest rate sensitivity than a core bond strategy
  • Less credit sensitivity than a dedicated high yield bond strategy

A Record of Regular Distributions

Monthly distribution yield - Class I Shares (4/30/14 – 3/31/24)

Multi Sector Income q1 2024
The Fund’s Distribution Yield has been above 4% for 107 out of 115 months since inception.
30 Day SEC Yield without waivers, or “unreimbursed” meaning it does not take into account a fund’s expense reduction, and reflects an estimated yield to maturity. It should be regarded as an estimate of the fund’s rate of net investment income, and it may not equal the fund’s actual income distribution rate, which reflects a fund’s past dividends paid to shareholders. The 30 Day SEC Yield without waivers is calculated in accordance with SEC standards.
30 Day SEC Yield with waivers, or “reimbursed” meaning it takes into account a fund’s expense reduction, and reflects an estimated yield to maturity. It should be regarded as an estimate of the fund’s rate of investment income, and it may not equal the fund’s actual income distribution rate, which reflects a fund’s past dividends paid to shareholders. The 30 Day SEC Yield with waivers is calculated in accordance with SEC standards.

PORTFOLIO MANAGEMENT

Seth Meyer, CFA

Global Head of Client Portfolio Management | Portfolio Manager

Industry since 1998. Joined Firm in 2004.

John Kerschner, CFA

Head of US Securitised Products | Portfolio Manager

Industry since 1990. Joined Firm in 2010.

John Lloyd

Lead, Multi-Sector Credit Strategies | Portfolio Manager

Industry since 1998. Joined Firm in 2005.

Performance

RETURNS (%) (As of 03/31/2024)
Multi-Sector Income Fund - I Shares Bloomberg U.S. Aggregate Bond Index
 
3M YTD 1YR 3YR 5YR 10YR Since Inception
(02/28/2014)
Multi-Sector Income Fund - I Shares 1.51 1.51 8.29 0.20 2.81 3.73 3.71
Bloomberg U.S. Aggregate Bond Index -0.78 -0.78 1.70 -2.45 0.36 1.54 1.51
RETURNS (%) (As of 05/31/2024)
Multi-Sector Income Fund - I Shares Bloomberg U.S. Aggregate Bond Index
 
3M YTD 1YR 3YR 5YR 10YR Since Inception
(02/28/2014)
Multi-Sector Income Fund - I Shares 1.58 1.80 7.85 -0.09 2.56 3.52 3.68
Bloomberg U.S. Aggregate Bond Index 0.04 -1.64 1.31 -3.10 -0.17 1.26 1.40
Calendar Year Returns (%)
Multi-Sector Income Fund - I Shares Bloomberg U.S. Aggregate Bond Index
2023 2022 2021 2020 2019 2018 2017 2016 2015
Multi-Sector Income Fund - I Shares 10.33 -11.93 3.24 5.46 11.19 0.63 6.70 7.86 1.83
Bloomberg U.S. Aggregate Bond Index 5.53 -13.01 -1.54 7.51 8.72 0.01 3.54 2.65 0.55

MORNINGSTAR PERCENTILE

(As Of 06/30/2024)
1 YR 3 YR 5 YR 10 YR SINCE INCEPTION
Percentile Ranking 36 49 35 8 9
Multisector Bond | Rank/Count 122/331 138/304 101/272 18/206 18/206
(As Of 06/30/2024)
1 YR 3 YR 5 YR 10 YR SINCE INCEPTION
Percentile Ranking 36 49 35 8 9
Multisector Bond | Rank / Count 122/331 138/304 101/272 18/206 18/206

RETURNS-BASED STATISTICS (As of 04/30/2024 Class I Shares)

RISK / REWARD
VS. Bloomberg U.S. Aggregate Bond TR Index
3YR 5YR
Information Ratio 1.05 0.37
Alpha 1.55 2.16
Tracking Error 2.79 6.42
Beta 0.79 0.82
R-squared (%) 85.92 39.70
UP/DOWN MARKET CAPTURE (%)
VS. Bloomberg U.S. Aggregate Bond TR Index
3YR 5YR
Up Capture Ratio 79.69 104.71
Down Capture Ratio 64.30 76.58
STANDARD DEVIATION 3YR 5YR
Multi-Sector Income Fund 6.36 8.11
Bloomberg U.S. Aggregate Bond TR Index 7.30 6.21
SHARPE RATIO 3YR 5YR
Multi-Sector Income Fund -0.53 0.03
Bloomberg U.S. Aggregate Bond TR Index -0.84 -0.34
ANNUAL FEES & EXPENSES (As of the most recent prospectus)
CLASS I SHARES
Management Fees 0.56%
Other Expenses 0.16%
Total Gross Expenses 0.72%
Waivers 0.00%
Total Net Expenses 0.72%

Portfolio

Index represents the Bloomberg Barclays U.S. Aggregate Bond Index.

Top Holdings (As of 05/31/2024)
% of Fund
Fannie Mae or Freddie Mac, 4.00%, 06/13/24 3.45
Fannie Mae or Freddie Mac, 6.00%, 06/13/24 2.60
Fannie Mae or Freddie Mac, 5.50%, 06/13/24 2.22
Ginnie Mae, 3.50%, 06/20/24 2.18
Fannie Mae or Freddie Mac, 4.50%, 06/13/24 2.15
Fannie Mae or Freddie Mac, 3.00%, 06/13/24 2.05
Fannie Mae or Freddie Mac, 3.50%, 06/13/24 1.56
CBAM 2021-14 Ltd, 6.69%, 04/20/34 1.51
Fannie Mae or Freddie Mac, 5.00%, 06/13/24 1.11
Freddie Mac STACR REMIC Trust 2021-DNA7, 8.97%, 11/25/41 0.76
TOTAL 19.59
View full holdings
Portfolio Characteristics (As of 05/31/2024)
  FUND INDEX
Number of Holdings
Debt Issues
681 13541
Portfolio Turnover Rate
(1-year trailing)
35.70% -
Weighted Average Maturity
(years)
5.46 12.58
Effective Duration
(years)
4.11 6.09
Yield to Worst
8.08% 5.11%
Sector Allocation % of Fund % of Index % of Fund % of Index As of 05/31/2024
Regional Allocation % of Fund % of Index % of Fund % of Index As of May 31, 2024
Developed vs Emerging Markets % of Fund % of Index % of Fund % of Index As of May 31, 2024
Credit Quality of Fixed Income Holdings % of Fund % of Index % of Fund % of Index As of May 31, 2024
Maturity Breakdown of Fixed Income Holdings % of Fund % of Index % of Fund % of Index As of 05/31/2024

Documents