Please ensure Javascript is enabled for purposes of website accessibility Flexible Bond Fund - Janus Henderson Investors - US Advisor
For Financial Professionals in the US

JFLEX Flexible Bond Fund

A flexible core plus fixed income portfolio that leverages a research-driven investment process in seeking to identify the best opportunities across fixed income sectors

NAV
$9.17
As of 01/24/2025

1-Day Change
$0.01 (0.12%)
As of 01/24/2025

YTD Return
0.23%
As of 01/24/2025

Overview

ABOUT THIS FUND

Using our broad global research capabilities, we strive to exploit fixed income market inefficiencies by building a structural foundation that we believe serves as a better starting point than traditional benchmarks. We aim to generate outperformance through sector rotation and security selection and by seeking to take the right amount of risk at each point in the cycle.

WHY INVEST IN THIS FUND

Our Team: Culture of collaboration, global integration and respectful challenge with a research-first mentality

Disciplined Risk Budgeting: Disciplined investment process targets repeatable performance utilizing our structural foundation as a better starting point

High Conviction: Bottom-up idea generation across a diverse set of return sources, incorporating dynamic allocation through market cycles

Portfolio Management

Greg Wilensky, CFA

Head of US Fixed Income/Head of Core Plus | Portfolio Manager

Industry since 1993. Joined Firm in 2020.

Michael Keough

Portfolio Manager

Industry since 2006. Joined Firm in 2007.

John Lloyd

Lead, Multi-Sector Credit Strategies | Portfolio Manager

Industry since 1998. Joined Firm in 2005.

Performance

RETURNS (%) (As of 12/31/2024)
Flexible Bond Fund - I Shares Bloomberg U.S. Aggregate Bond Index
 
3M YTD 1YR 3YR 5YR 10YR Since Inception
(07/07/1987)
Flexible Bond Fund - I Shares -3.04 1.98 1.98 -2.31 0.51 1.72 5.70
Bloomberg U.S. Aggregate Bond Index -3.06 1.25 1.25 -2.41 -0.33 1.35 5.33
RETURNS (%) (As of 12/31/2024)
Flexible Bond Fund - I Shares Bloomberg U.S. Aggregate Bond Index
 
3M YTD 1YR 3YR 5YR 10YR Since Inception
(07/07/1987)
Flexible Bond Fund - I Shares -3.04 1.98 1.98 -2.31 0.51 1.72 5.70
Bloomberg U.S. Aggregate Bond Index -3.06 1.25 1.25 -2.41 -0.33 1.35 5.33
Calendar Year Returns (%)
Flexible Bond Fund - I Shares Bloomberg U.S. Aggregate Bond Index
2024 2023 2022 2021 2020 2019 2018 2017 2016 2015
Flexible Bond Fund - I Shares 1.98 5.89 -13.66 -0.78 10.88 9.56 -0.87 3.62 2.65 0.11
Bloomberg U.S. Aggregate Bond Index 1.25 5.53 -13.01 -1.54 7.51 8.72 0.01 3.54 2.65 0.55

Morningstar Percentile

 (As of 12/31/2024)
1 YR 3 YR 5 YR 10 YR SINCE INCEPTION
Percentile Ranking 64 62 32 44 26
Intermediate Core-Plus Bond | Rank/Count 345/581 286/541 145/497 177/421 19/80
 (As of 12/31/2024)
1 YR 3 YR 5 YR 10 YR SINCE INCEPTION
Percentile Ranking 64 62 32 44 26
Intermediate Core-Plus Bond | Rank / Count 345/581 286/541 145/497 177/421 19/80

Growth of a Hypothetical Investment

Flexible Bond Fund - I Shares Bloomberg U.S. Aggregate Bond Index Intermediate Core-Plus Bond

Returns-Based Statistics (As of 12/31/2024 Class I Shares)

RISK / REWARD
VS. Bloomberg U.S. Aggregate Bond TR Index
3YR 5YR
Information Ratio 0.11 0.47
Alpha 0.31 1.04
Tracking Error 0.88 1.79
Beta 1.03 1.06
R-squared (%) 98.90 93.82
UP/DOWN MARKET CAPTURE (%)
Bloomberg U.S. Aggregate Bond TR Index
3YR 5YR
Up Capture Ratio 103.72 117.55
Down Capture Ratio 101.66 105.39
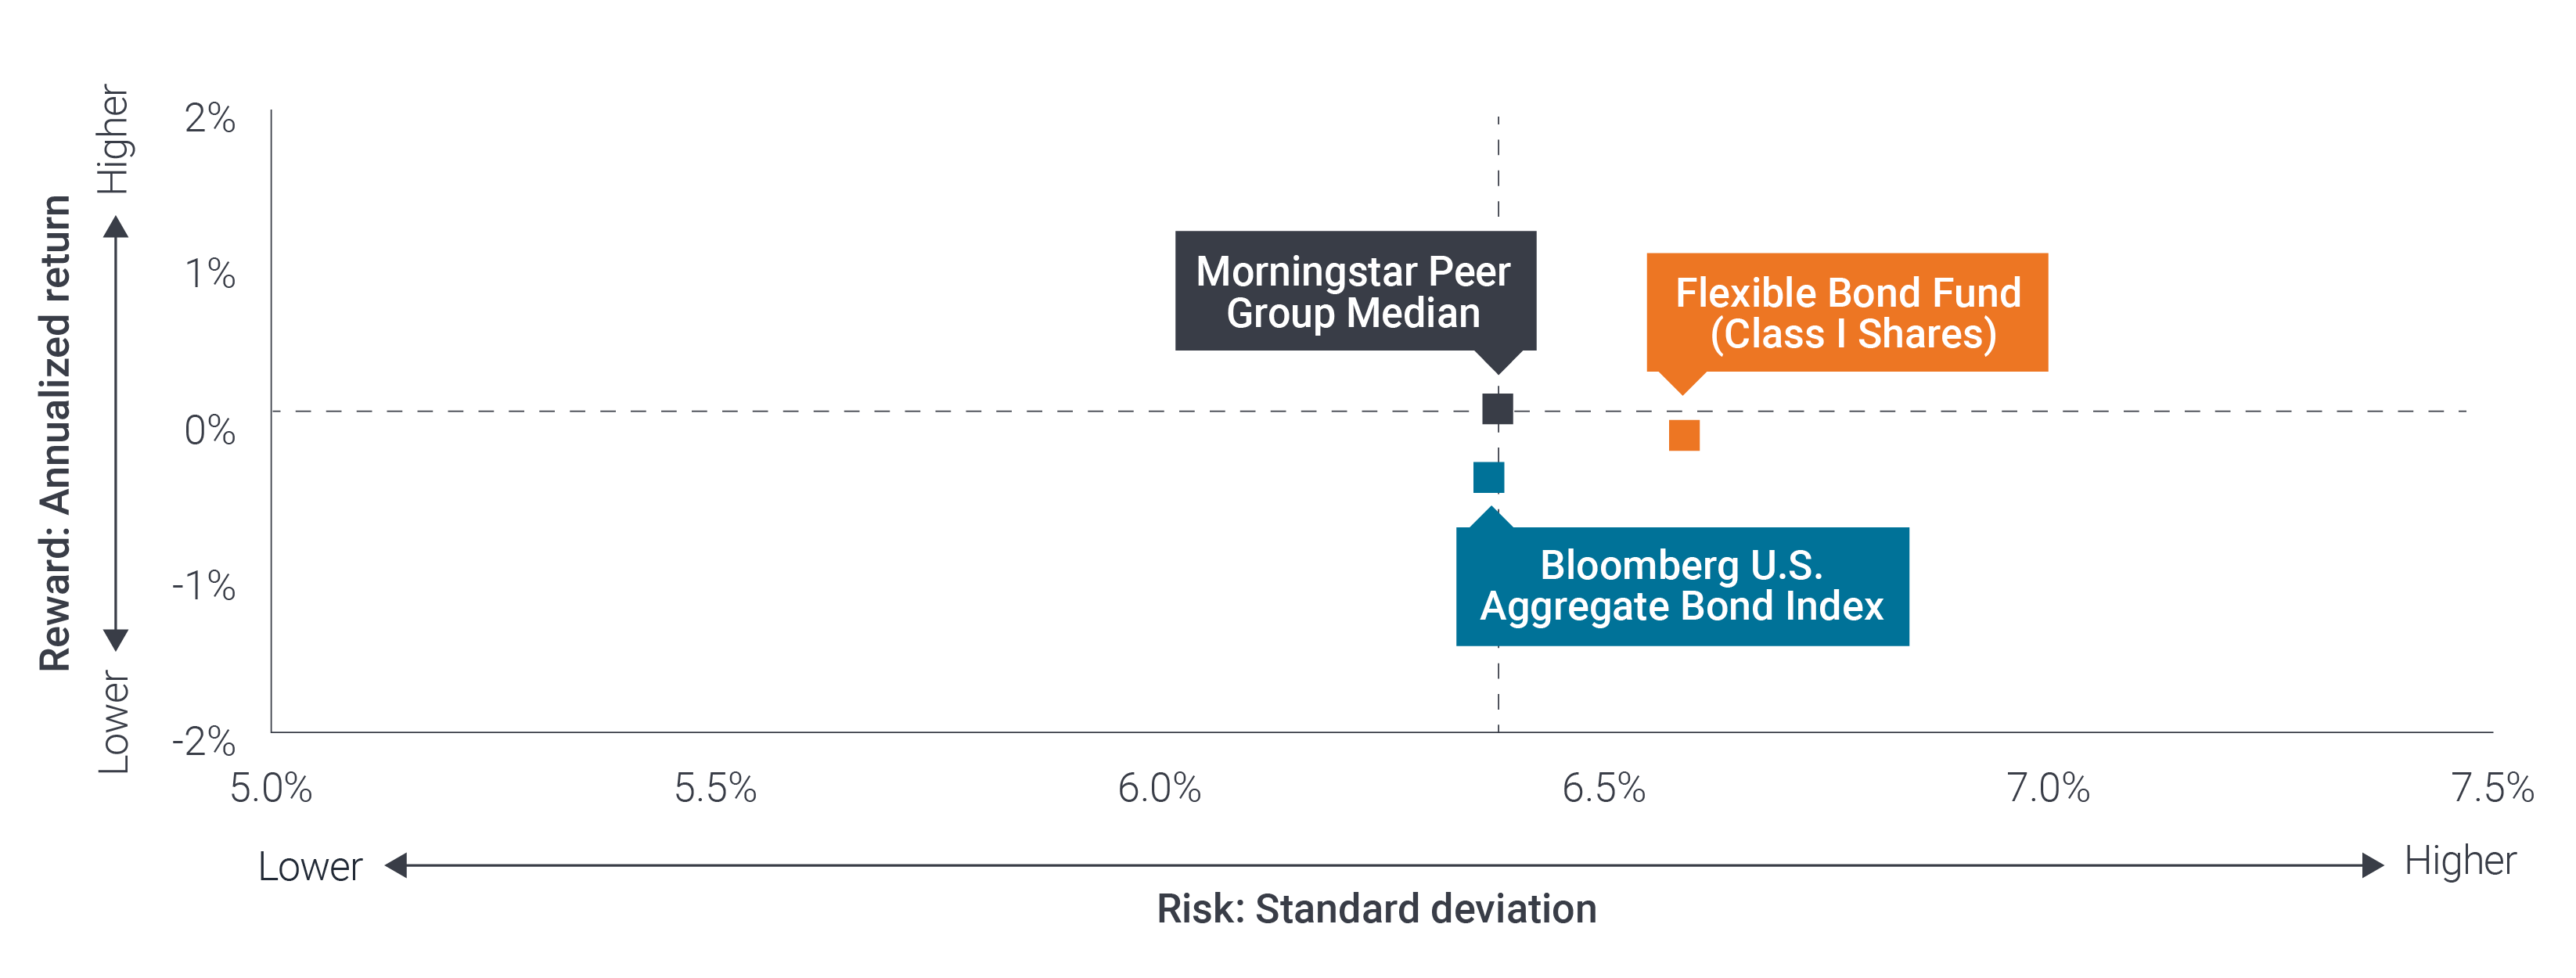
STANDARD DEVIATION 3YR 5YR
Flexible Bond Fund 8.12 7.03
Bloomberg U.S. Aggregate Bond TR Index 7.83 6.42
SHARPE RATIO 3YR 5YR
Flexible Bond Fund -0.76 -0.28
Bloomberg U.S. Aggregate Bond TR Index -0.79 -0.43
Annual Fees & Expenses (As of the most recent prospectus)
CLASS I SHARES
Management Fees 0.41%
Other Expenses 0.13%
Total Gross Expenses 0.54%
Waivers -0.06%
Total Net Expenses 0.48%

Portfolio

Index represents the Bloomberg Barclays U.S. Aggregate Bond Index.

Top Holdings (As of 12/31/2024)
% of Fund
United States Treasury Note/Bond, 4.25%, 11/15/34 4.32
United States Treasury Note/Bond, 4.12%, 11/30/29 2.44
United States Treasury Note/Bond, 4.38%, 07/31/26 0.84
Citigroup Inc, 5.59%, 11/19/34 0.83
Ginnie Mae, 2.50%, 01/21/25 0.77
Fannie Mae Pool, 2.50%, 02/01/52 0.69
Fannie Mae Pool, 5.50%, 07/01/53 0.64
Centene Corp, 4.25%, 12/15/27 0.61
CF Hippolyta Issuer LLC, 6.11%, 08/15/62 0.60
Ginnie Mae II Pool, 3.00%, 08/20/51 0.59
TOTAL 12.33
View full holdings
Portfolio Characteristics (As of 12/31/2024)
  FUND INDEX
Number of Holdings
Debt Issues
632 13691
Portfolio Turnover Rate
(1-year trailing)
143.42% -
Weighted Average Maturity
(years)
6.34 12.41
Effective Duration
(years)
6.64 6.06
Yield to Worst
5.72% 4.90%
Sector Allocation % of Fund % of Index % of Fund % of Index As of 12/31/2024
Regional Allocation % of Fund % of Index % of Fund % of Index As of 12/31/2024
Developed vs Emerging Markets % of Fund % of Index % of Fund % of Index As of 12/31/2024
Credit Quality of Fixed Income Holdings % of Fund % of Index % of Fund % of Index As of 12/31/2024
Maturity Breakdown of Fixed Income Holdings % of Fund % of Index % of Fund % of Index As of 12/31/2024

Documents