Subscribe
Sign up for timely perspectives delivered to your inbox.
Global equity markets have reached new heights in 2024 and whilst some sectors exhibit elevated valuations, the PCS team see plenty of reasons for astute investors to feel optimistic.

Less than halfway through this decade, and the world economy has been through a full cycle, having faced some significant headwinds, including a global pandemic, wars breaking out in Europe and the Middle East and a general trend towards deglobalisation. Yet despite these headwinds, the world economy has remained largely resilient.
The reaction from equity markets has been generally positive, with the US equity market in particular reaching over 30 new all-time highs at the time of writing, led by gains in the technology sector.
This poses some questions to investors, mainly, is it too late to invest in equities, and are they overvalued?
To answer this, it is important to look at the fundamental drivers of equity market returns, and look deeper into each market to find the opportunities.
While headlines about equity markets abound, each country and each sector has had mixed experiences, leaving some underappreciated. This is where astute investors should look to unearth opportunities.
To help us do this, we focus on two fundamental metrics as the starting point:
When we compare the current forward P/E ratio versus its 10-year average, we can start to see which areas of the market could represent attractive valuation opportunities. Note that to do this, we break the global market down by sector (Exhibit 1).
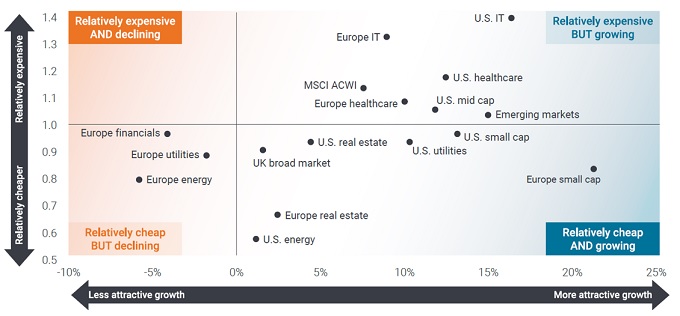
Source: Bloomberg, Janus Henderson Investors, at 31 March 2024. Valuation (x axis) shows 12-month forward price-to-earnings (P/E) ratio relative to 10-year average. Growth (y axis) shows projected earnings per share (EPS) growth rates for 2024 and 2025. Dots represent the largest components of the MSCI ACWI and GICS sectors, based on region, sector and market capitalization[1]. Note: There is no guarantee that past trends will continue, or forecasts will be reached.
The dispersion of valuations and growth expectations between sectors shown in Exhibit 1 indicates the importance of careful stock and sector selection. The valuations shown on the y-axis indicate several global sectors that appear to be relatively expensive. However, most importantly, many of these sectors are showing attractive forward-looking growth expectations (x-axis). There are also a lot of companies that are relatively cheap and offering attractive growth prospects.
Investors are familiar with the mantra that past performance does not predict future returns. This can be paraphrased to trailing PE ratios do not reflect future performance. Performance is the product of earnings growth. Companies that grow earnings at a faster pace are generally more likely to offer better potential returns than companies with slower growing or shrinking earnings.
Avoiding equities simply because they appear expensive on a PE ratio basis can leave investors missing out on significant return opportunities. The Magnificent 7, for example, the big seven tech stocks in the S&P500 Index, have been the centre of a lot of investor interest for an extended period. Over the past nine[2] years they have consistently traded well above the MSCI ACWI index on a PE ratio basis, see Exhibit 2. On that metric, they have been “expensive”.

Source: Bloomberg, Janus Henderson Investors. All values are quarterly. Data as of May 31, 2024. Mag 7 corresponds to the Bloomberg Magnificent 7 Index and ACWI is the MSCI ACWI Index. Past performance does not predict future returns.
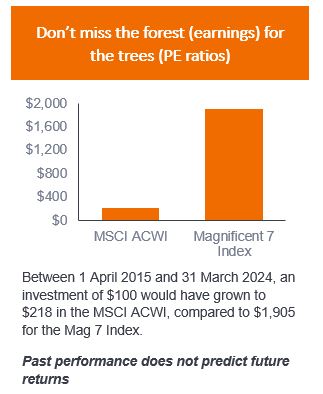 Yet earnings for the Magnificent 7 stocks continued to grow faster than expected, delivering strong returns for investors, who would have accumulated almost nine times as much wealth than they would have in the MSCI ACWI Index[3].
The point here is not about buying the Magnificent 7; rather that earnings and earnings power should be the main considerations when investing, rather than whether or not the PE ratio appears high or low. Valuation by itself does not determine future earnings or performance.
High valuations in the form of high PE ratios are not to be feared and areas of the market that appear expensive, might prove to pack great promise and should not be ignored.
Technology is a great example of this. We believe investors could miss out on opportunities if they narrow their focus solely by price. Valuations need to consider earnings growth potential. While the tech sector looks expensive compared to historic averages, the argument for continued robust growth remains intact, given the structural changes occurring in society and the role that technology plays in those changes.
On the other hand, there are many sectors that look relatively cheap, despite having the ability to grow earnings. We saw this in Exhibit 1, where many areas fall in the relatively cheap but growing quadrant. We highlight some sectors and explain why they might be attractive for investors going forward.
We know investing is not simple, so just looking at earnings expectations and historical valuations comparisons will not guarantee success. Within each category there will be winners and losers – especially in this higher rate environment where business models are being tested. It is therefore more important than ever to identify companies that are well positioned for growth, have the fundamentals to show it, and have strong balance sheets to withstand this “higher for longer” interest rate environment.
There will be challenges and bouts of volatility along the way, but it is usually in these times that the best opportunities emerge.
—–
[1] List of indices used for Exhibit 1: Europe small cap = MSCI Europe Small Cap Index; Emerging markets = MSCI EM Index; Europe financials = Europe GICS Sectors Financials; Europe energy = Europe GICS Sectors Energy; Europe utilities = Europe GICS Sectors Utilities; Europe real estate = Europe GICS Sectors Real Estate; U.S. IT = US GICS Sectors Info Tech; Europe IT = Europe GICS Sectors Info Tech; U.S. energy = US GICS Sectors Energy; U.S. mid cap = MSCI Europe Mid Cap Index; U.S. small cap = MSCI US Small Cap Index; UK = MSCI United Kingdom Index; U.S. healthcare = US GICS Sectors Healthcare; U.S. utilities = US GICS Sectors Utilities; U.S. real estate = US GICS Sectors Real Estate.
[2] From 1 April 2015 to 31 March 2024, an investment of $100 would have grown to $218 in the MSCI ACWI about one ninth of the $1,905 generated by the Mag 7 Index. Source: Bloomberg, Janus Henderson Investors data at 31 May 2024.
[3] The earliest available PE Ratio for the Bloomberg Magnificent 7 Index is from June 2015
Glossary
Balance sheet: A financial statement that summarises a company’s assets, liabilities and shareholders’ equity at a particular point in time. Each segment gives investors an idea as to what the company owns and owes, as well as the amount invested by shareholders. It is called a balance sheet because of the accounting equation: assets = liabilities + shareholders’ equity.
Forward price-to-earnings (P/E) ratio: The P/E ratio is a popular method of valuing a company’s shares, compared to other stocks, or a benchmark index. It is calculated by dividing the current share price by its earnings per share. Forward P/E is a version of the P/E ratio that utilises forecasted earnings in its calculation.
Magnificent Seven: The major seven technology stocks in the S&P 500 Index – Alphabet, Amazon, Apple, Meta, Microsoft, Nvidia and Tesla.
Mid-cap stocks: Companies with a valuation (market capitalisation) within a certain scale, eg. $2-10 billion in the US, although these measures are generally an estimate.
MSCI All Country World Index (MSCI ACWI): An equity index that tracks the share price movements of stocks from 23 developed countries and 24 emerging markets countries.
Small-cap stocks: Companies with a valuation (market capitalisation) within a certain scale, eg. $300 million to $2 billion in the US, although these measures are generally an estimate. Small cap stocks tend to offer the potential for faster growth than their larger peers, but with greater volatility.
S&P500 Index: A stock market index that tracks the share prices of the largest 500 companies listed on US stock exchanges.
Volatility: The rate and extent at which the price of a portfolio, security or index, moves up and down. If the price swings up and down with large movements, it has high volatility. If the price moves more slowly and to a lesser extent, it has lower volatility. The higher the volatility the higher the risk of the investment.
Sign up for timely perspectives delivered to your inbox.