
Key takeaways:
- The high yield bond market has actively shrunk but a significant portion of that is due to the value of bonds moving up to investment grade outpacing those falling into high yield.
- Moderate growth is allowing better companies to be upgraded but higher refinancing costs are putting pressure on weaker borrowers leading to dispersion in spreads between credit ratings cohorts.
- We believe careful analysis across all the ratings cohorts can be rewarded but retain a preference for higher quality issuers given the uncertain economic backdrop.
There has been a strong technical tailwind to high yield bonds for the past year, as a shrinking market has met robust demand. The result has been a downward squeeze on spreads (the additional yield that a corporate bond offers over a government bond of the same maturity). At first glance this all seems positive but there are two sides to every coin. For high yield investors it is worth being aware of both the benefits and the risks.
A shrinking market
As Figure 1 shows, the last couple of years have seen the global high yield bond market shrink in size, with the par value outstanding falling by 18% since the end of 2021. The positive for high yield bond investors is that a smaller market creates scarcity value, although at over US$2 trillion in size, with more than 3,200 bonds from 1,500 issuers, the global high yield bond market remains a diverse market.1
Figure 1: Face value of global high yield market
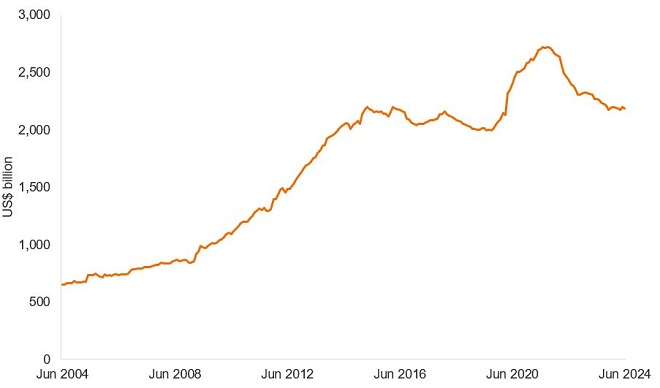
Source: Bloomberg, ICE BofA Global High Yield Index, face value, US$ billion, 30 June 2004 to 30 June 2024.
Ironically, the market has been a victim of the success of its constituents, with some high-profile names moving from high yield to investment grade status (so-called rising stars) and exiting the high yield index. Last year, Ford, the auto company, was the biggest borrower to make the move. In the first half of 2024, rising stars so far have included Rolls Royce, the British aerospace business, Enlink Midstream, a US processor and distributor of oil and natural gas, First Energy, the US electricity utility, and Cellnex, the Spanish telecoms group. The broad sector spread has been encouraging, reflecting both a recovery to a more normal operating environment following pandemic-induced instability and stronger earnings helping to drive declines in leverage.
That is not to say the movement is all one way. Fallen angels (companies moving down from investment grade and entering the high yield index) this year include Hudson Pacific Properties, a US based office property group, Travis Perkins, the UK builders’ merchant, Alstria Office REIT, the German office real estate investment trust, and Elo, a French holding company straddling retail, real estate, and payments.
Taken together, however, the face value of rising stars has eclipsed fallen angels, contributing to a shrinking market. This is clear in Figure 2, which relates to the European high yield market. Since the start of 2022 there has been plenty of new supply, but this has been offset by maturing bonds and bonds being bought back ahead of maturity through a call/tender offer. Defaults are another (clearly unwelcome) way that high yield bonds can leave the index, although so far defaults have remained fairly contained.
Figure 2: The building blocks driving the decline in European high yield
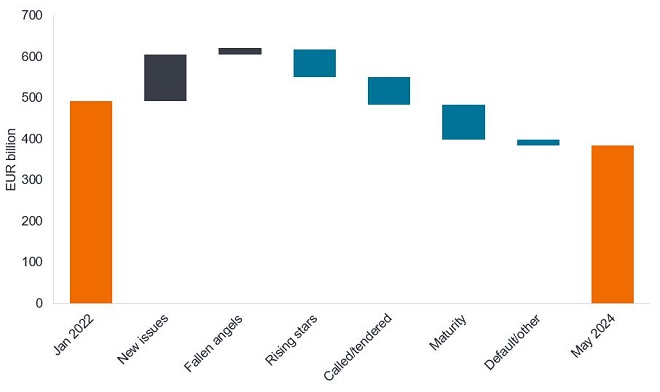
Source: Barclays Research, Bloomberg, 10 May 2024. Note all in EUR equivalent. Changes in foreign exchange rates mean the sum of the building blocks does not perfectly equate to the change in market size.
Private credit cannibalisation
Both in the US and Europe there has also been some cannibalisation of the debt markets by private credit which has displaced debt that might have been issued in the public capital markets. This phenomenon is evident in both the US and Europe. Barclays noted that private credit makes up around 21% of leveraged finance in the US and 34% in Europe, compared with around 40% by high yield bonds and the remainder in both markets from leveraged loans.2 It is in the area of leveraged buyouts that private credit has potentially displaced high yield bonds the most, given a drop in syndicated high yield deals and a rise in direct lending.
We see private and public debt markets co-existing because corporate borrowers value the useful competition this creates regarding lending terms and rates. While this may contribute to slightly lower yields for investors on high yield bonds there is likely an offsetting benefit – private credit may play a crucial role in suppressing default rates by stepping in to provide funding under more restrictive credit conditions.
Does size matter?
Optically, it seems better when a market is growing as it is suggestive of investor appetite and liquidity. But a contraction or flatlining of the market size can actually be good for investors.
It can be symptomatic of companies prioritising debt reduction, which tends to happen when the cost of capital has risen. It will be interesting to see whether the relative tightness in spreads leads to a change in corporate behaviour and a pick-up in less credit-friendly activities such as debt fuelled takeovers and share buybacks.
We have already mentioned rising stars outpacing fallen angels as credit quality at issuers improves, although the pace has been decelerating. Here we need to be mindful that most rising stars move up from a BB rating (the highest quality high yield cohort) into BBB (the lowest quality investment grade cohort). This can have the effect of shrinking the proportion of issuers rated BB if there are not corresponding upward ratings moves further down the rating spectrum.
Looking at the global index in Figure 3, there was a contraction in the proportion of BB rated bonds in 2022-23 but there has been an improvement since the start of 2024. What has been noticeable is a decline in the size of the B rated cohort which has been hollowed in both directions recently as some issuers are upgraded and others drop into the CCC or lower cohort. An example of the latter in 2024 was the downgrade of Altice, the France-based telecoms group, which is suffering from negative free cash flow and concerns that the company may seek distressed exchanges to help lower its debt to a more sustainable level.
Figure 3: Ratings breakdown as % of Global High Yield Index
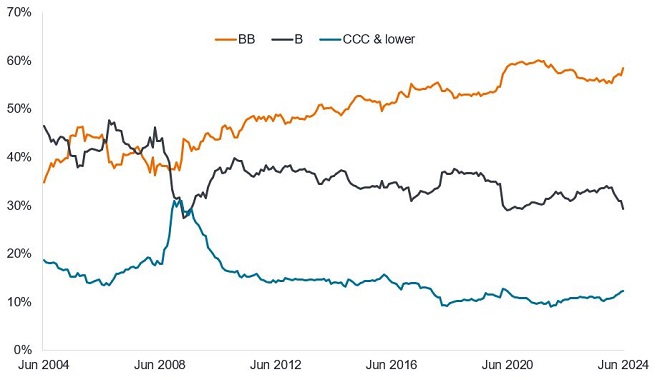
Source: Bloomberg, ICE BofA BB Global High Yield Index, ICE BofA B Global High Yield Index, ICE BofA CCC & Lower Global High Yield Index, face value in US dollars represented as % of the ICE BofA Global High Yield Index, 30 June 2004 to 30 June 2024.
Mindful of spreads
All told, we think the technical outlook for the asset class remains favourable. Outside of a recession we think investors will continue to see attractions in the yields on offer in high yield bonds, particularly if interest rates come down. With many high yield bonds also trading below their par value, there is a useful pull to par in bond prices as bonds get closer to maturity. We are mindful, however, that credit spreads within high yield are relatively tight so we need to keep a careful lookout for events that could upset the corporate backdrop, such as geopolitics or negative developments in the economic data. That said, the reasonably supportive corporate backdrop of moderate economic growth and robust earnings we believe justifies spreads being towards their tight levels, particularly among the better quality issuers within the BB and B cohorts.
Figure 4: Dispersion in spreads albeit relatively tight in higher quality

Source: Morgan Stanley, Bloomberg, Pitchbook LCD, 5 July 2024. US and European high yield bond markets. Percentile is a statistical term used to express how a value compares to other values in the same dataset. Here a percentile of 12% for US HY means over the last 20 years, only 12% of observations of spreads have been tighter and 88% of the time spreads have been wider. The smaller the percentile, the tighter (lower) the spread compared with history. Figures after the bars are the option-adjusted spread on 5 July 2024 in basis points for that ratings cohort. Basis point (bp) equals 1/100 of a percentage point, 1bp = 0.01%. The spread is the difference in yield between a corporate bond and the yield on a government bond of similar maturity. Yields and spreads may vary over time and are not guaranteed.
The lagged impact of earlier monetary tightening means idiosyncratic risk is building among companies, however, necessitating careful analysis of credit fundamentals. Bank of America noted that among US high yield bonds since 2022, the higher quality borrowers had refinanced around 30-35% of their debt while the bottom 20% by credit quality had managed to refinance only 15% of their debt.3
This is just one of the reasons why we are more cautious towards the lower quality end of high yield. There are selective opportunities among the lower rated bonds but we want to avoid being caught in distressed bonds. We therefore see the remainder of 2024 as a time to favour active investing, seeking to squeeze out the value among the attractive yields on offer in the asset class.
1Source: Bloomberg, ICE BofA Global High Yield Index, 1 July 2024.
2Source: Barclays, Private credit bridging the transatlantic divide, 1 March 2024.
3Source: BofA Global Research, High yield strategy, 14 June 2024.
The ICE BofA Global High Yield Index tracks the performance of USD, CAD, GBP and EUR denominated below investment grade corporate debt publicly issued in the major domestic or eurobond markets.
The ICE BofA BB Global High Yield Index is a subset of ICE BofA Global High Yield Index including all securities rated BB.
The ICE BofA B Global High Yield Index is a subset of ICE BofA Global High Yield Index including all securities rated B.
The ICE BofA CCC & Lower Global High Yield Index is a subset of ICE BofA Global High Yield Index including all securities rated CCC or lower.
Call: A callable bond is a bond that can be redeemed (called) early by the issuer prior to the maturity date.
Cash flow: The net amount of cash and cash equivalents transferred in and out of a company.
Corporate bond: A bond issued by a company. Bonds offer a return to investors in the form of periodic payments and the eventual return of the original money invested at issue on the maturity date.
Corporate fundamentals are the underlying factors that contribute to the price of an investment. For a company, this can include the level of debt (leverage) in the company, its ability to generate cash and its ability to service that debt.
Credit rating: A score given by a credit rating agency such as S&P Global Ratings, Moody’s and Fitch on the creditworthiness of a borrower. For example, S&P ranks investment grade bonds from the highest AAA down to BBB and high yields bonds from BB through B down to CCC in terms of declining quality and greater risk, i.e. CCC rated borrowers carry a greater risk of default.
Credit spread is the difference in yield between securities with similar maturity but different credit quality. Widening spreads generally indicate deteriorating creditworthiness of corporate borrowers, and narrowing indicate improving.
Default: The failure of a debtor (such as a bond issuer) to pay interest or to return an original amount loaned when due.
Distressed exchanges: When a bond issuer is considered distressed it means the issuing company is either in default or at high risk of default. A distressed exchange is a form of default, although not always included in default rates, where the borrower negotiates with bondholders, typically agreeing some form of debt relief.
High yield bond: Also known as a sub-investment grade bond, or ‘junk’ bond. These bonds usually carry a higher risk of the issuer defaulting on their payments, so they are typically issued with a higher interest rate (coupon) to compensate for the additional risk.
Idiosyncratic risk: Factors that are specific to a particular company and have little or no correlation with market risk.
Inflation: The rate at which prices of goods and services are rising in the economy.
Investment-grade bond: A bond typically issued by governments or companies perceived to have a relatively low risk of defaulting on their payments, reflected in the higher rating given to them by credit ratings agencies.
Leverage: The level of borrowing at a company. Leverage is an interchangeable term for gearing: the ratio of a company’s loan capital (debt) to the value of its ordinary shares (equity); it can also be expressed in other ways such as net debt as a multiple of earnings, typically net debt/EBITDA (earnings before interest, tax, depreciation and amortisation). Higher leverage equates to higher debt levels.
Leveraged buyouts: The acquisition of a company using a significant amount of borrowed money (debt) to meet the cost of the acquisition.
Maturity: The maturity date of a bond is the date when the principal investment (and any final coupon) is paid to investors. Shorter-dated bonds generally mature within 5 years, medium-term bonds within 5 to 10 years, and longer-dated bonds after 10+ years.
Par value: The original value of a security, such as a bond, when it is first issued. Bonds are usually redeemed at par value when they mature. Par value is typically quoted as 100. If a bond’s price is trading at say 105, it would be trading above par value, whereas if it was at say 90, it would be trading below par value.
Private credit: An asset defined by non-bank lending where the debt is not issued or traded on the public markets.
Refinancing: The process of revising and replacing the terms of an existing borrowing agreement, including replacing debt with new borrowing before or at the time of the debt maturity.
Share buyback:This is where a company buys back their own shares from the market, thereby reducing the number of shares in circulation.
Syndicated deal: A form of debt financing where a group of lenders work together to provide credit to a large borrower.
Tender offer: This is where a company makes an offer to its bondholders to repurchase a specific number of bonds at a specified price and time.
Yield: The level of income on a security over a set period, typically expressed as a percentage rate. For a bond, at its most simple, this is calculated as the coupon payment divided by the current bond price.
Volatility measures risk using the dispersion of returns for a given investment. The rate and extent at which the price of a portfolio, security or index moves up and down.
IMPORTANT INFORMATION
Fixed income securities are subject to interest rate, inflation, credit and default risk. The bond market is volatile. As interest rates rise, bond prices usually fall, and vice versa. The return of principal is not guaranteed, and prices may decline if an issuer fails to make timely payments or its credit strength weakens.
High yield or “junk” bonds involve a greater risk of default and price volatility and can experience sudden and sharp price swings.
Past performance does not predict future returns
References made to individual securities do not constitute a recommendation to buy, sell or hold any security, investment strategy or market sector, and should not be assumed to be profitable. Janus Henderson Investors, its affiliated advisor, or its employees, may have a position in the securities mentioned.