
Subscribe
Sign up for timely perspectives delivered to your inbox.
For years, advisor portfolios often outperformed by significantly overweighting U.S. stocks. But amid higher interest rates and other economic shifts, that approach may start to be challenged. Senior Portfolio Strategist Andrew Molinet of the Portfolio Construction and Strategy Team explains why advisors may want to give foreign stocks another look and offers three tips for choosing an international stock fund.

The average advisor portfolio allocates 19% of its equities to stocks outside the U.S.,1 despite 84% of the world’s economic activity2 and 65% of public companies with market caps over $5 billion being located internationally.3 Moreover, over the past decade, 82% of the highest-performing stocks annually originated from outside the U.S.4 Yet over the same period, the strategy of underweighting non-U.S. stocks has proven to be among the most effective asset allocation choices.
As such, advisors naturally may be skeptical of considering an approach that does not substantially overweight U.S. equities. But that may need to change. In fact, going forward, we see several reasons for advisors to consider bulking up the foreign stock holdings in their portfolios, and offer three tips for how to choose the right international equity fund for their clients.
Foremost is the existence of exceptional companies beyond U.S. borders. As illustrated in Exhibit 1, international markets have recently presented numerous attractive growth opportunities. In today’s environment, where the cost of capital is higher, we believe many non-U.S. domiciled companies look especially attractive thanks to strong and reliable cash flows, valuations relative to earnings visibility, and the capability to finance growth internally.
Aesop, the ancient Greek storyteller, once remarked, “It is possible to have too much of a good thing.” Currently, many advisor portfolios are overly concentrated in the high-flying tech stocks known as the Magnificent 7, overlooking the extensive growth opportunities available globally.
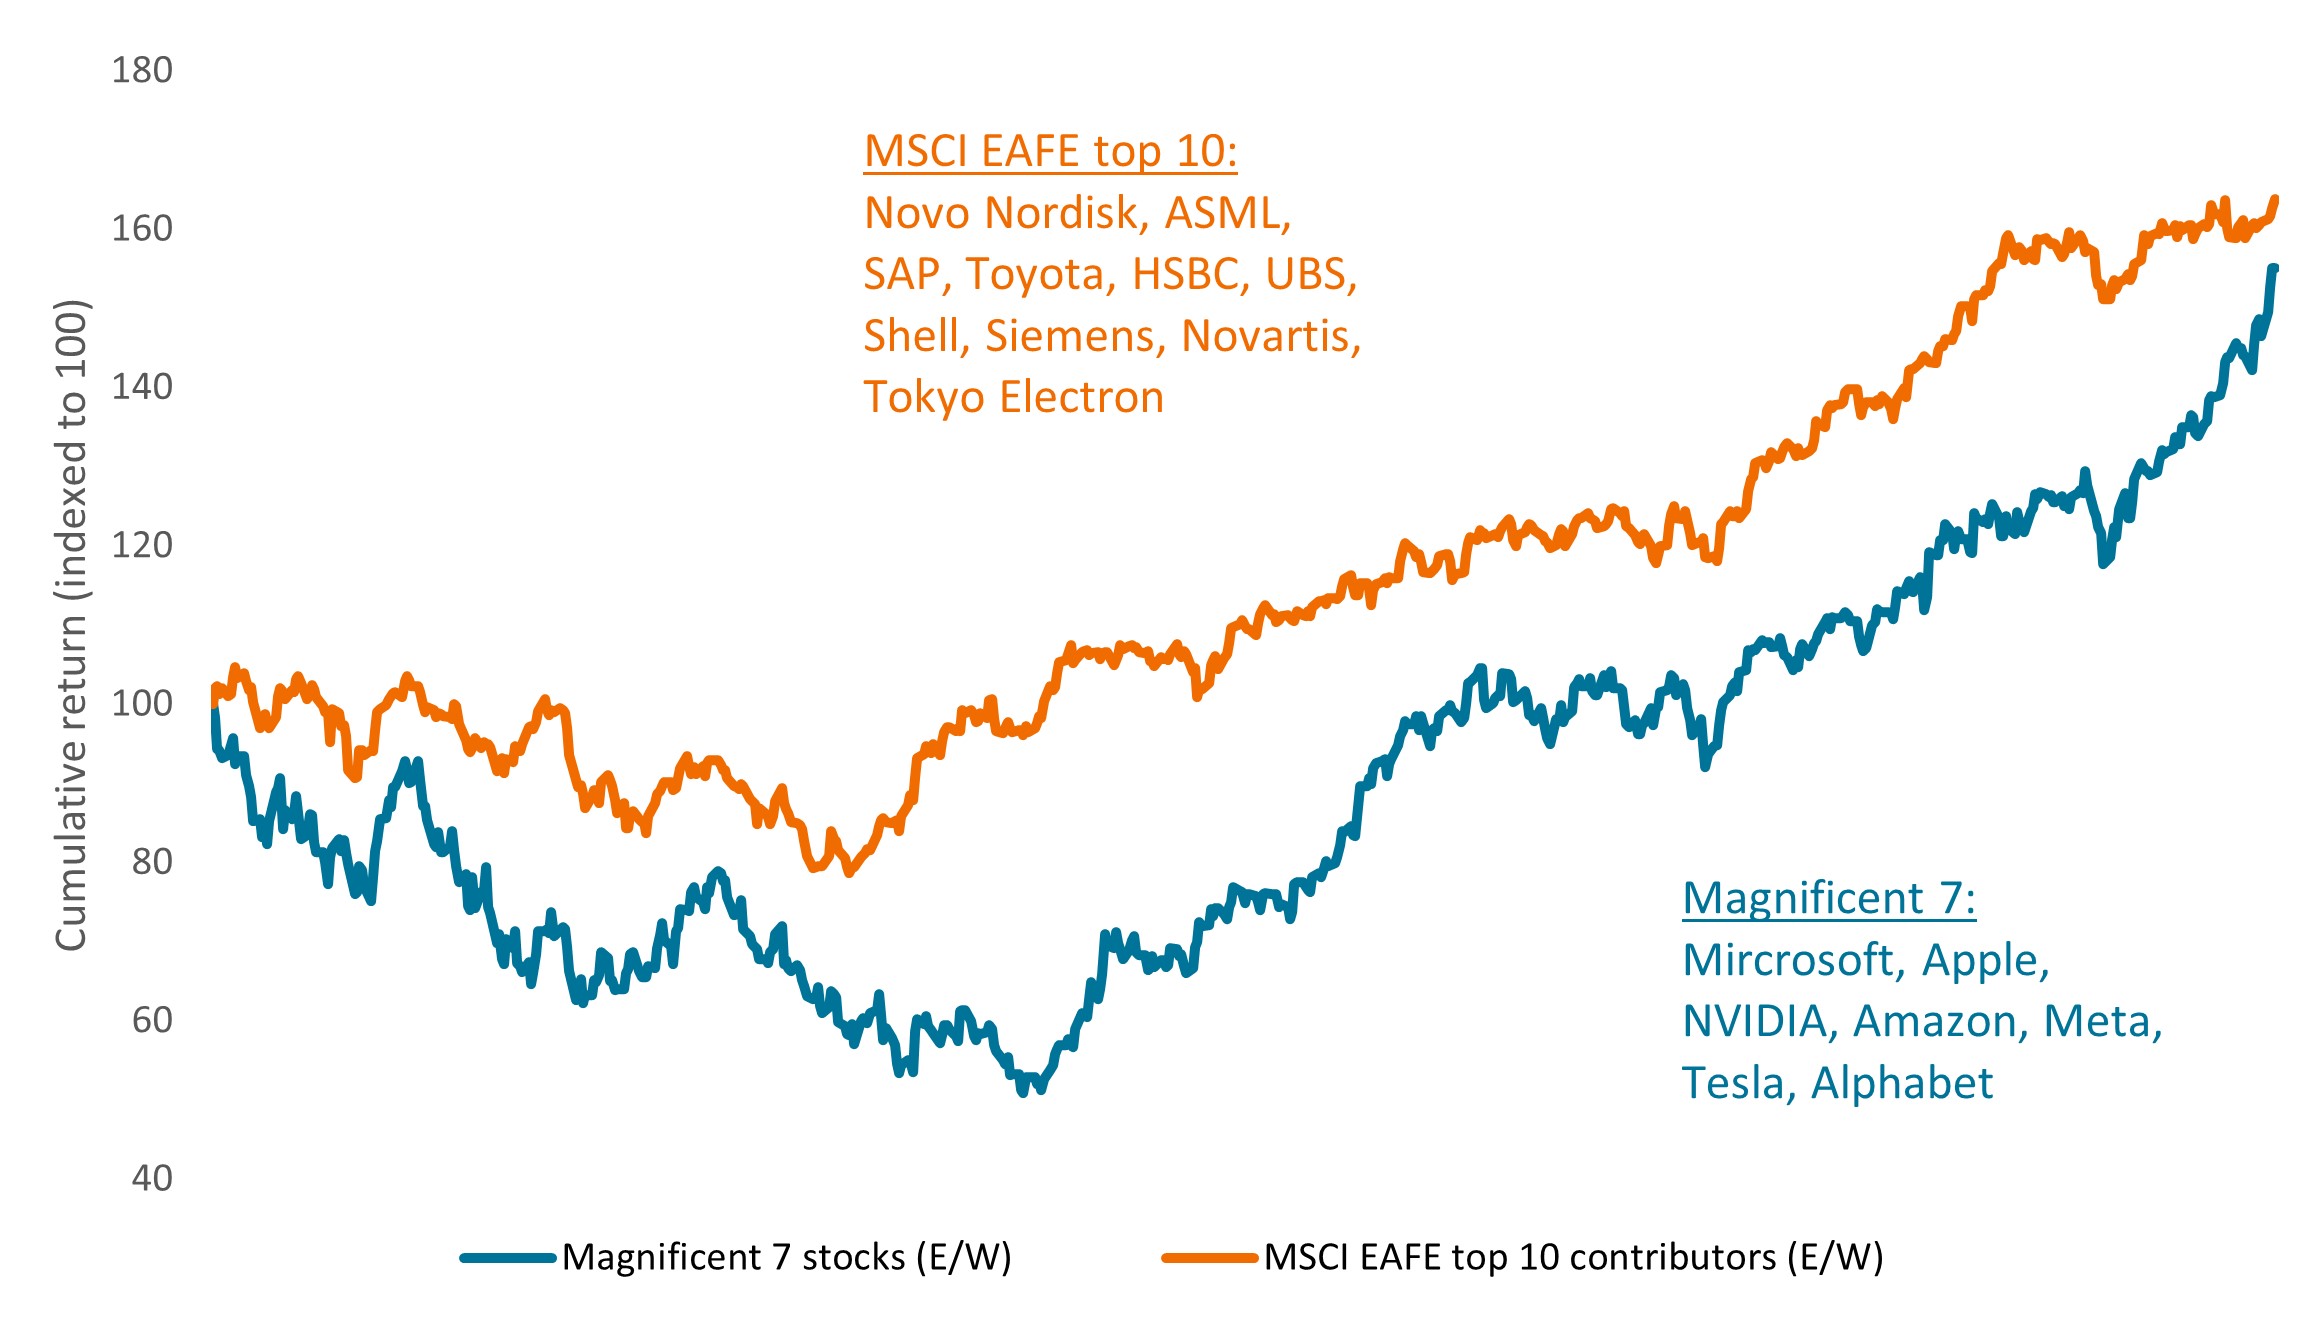
Source: JHI, Bloomberg, Morningstar. Magnificent 7 U.S. stocks were the top seven contributors to returns for 2023 in the S&P 500 Index. The MSCI EAFE top 10 are the top 10 contributors to returns for 2023 in the MSCI EAFE Index. Cumulative returns are indexed to 100 on 1 January 2022, and shown through 4 July 2024, and are calculated on an equal-weighted (e/w) basis for the stocks within each group.
The second reason stems from a notable uptick in Manufacturing Purchasing Managers’ Indices (PMIs) since mid-2023. Leading indicators, including the ratio of new orders to inventories, have hinted at a sustained improvement in Manufacturing PMIs. Typically, as Manufacturing PMIs rise, international equities tend to surpass U.S. equities in performance, owing to their cyclical nature. Although recent PMI figures have been mixed, they are not sufficiently negative to detract from the anticipated upward trajectory that we expect to persist.5
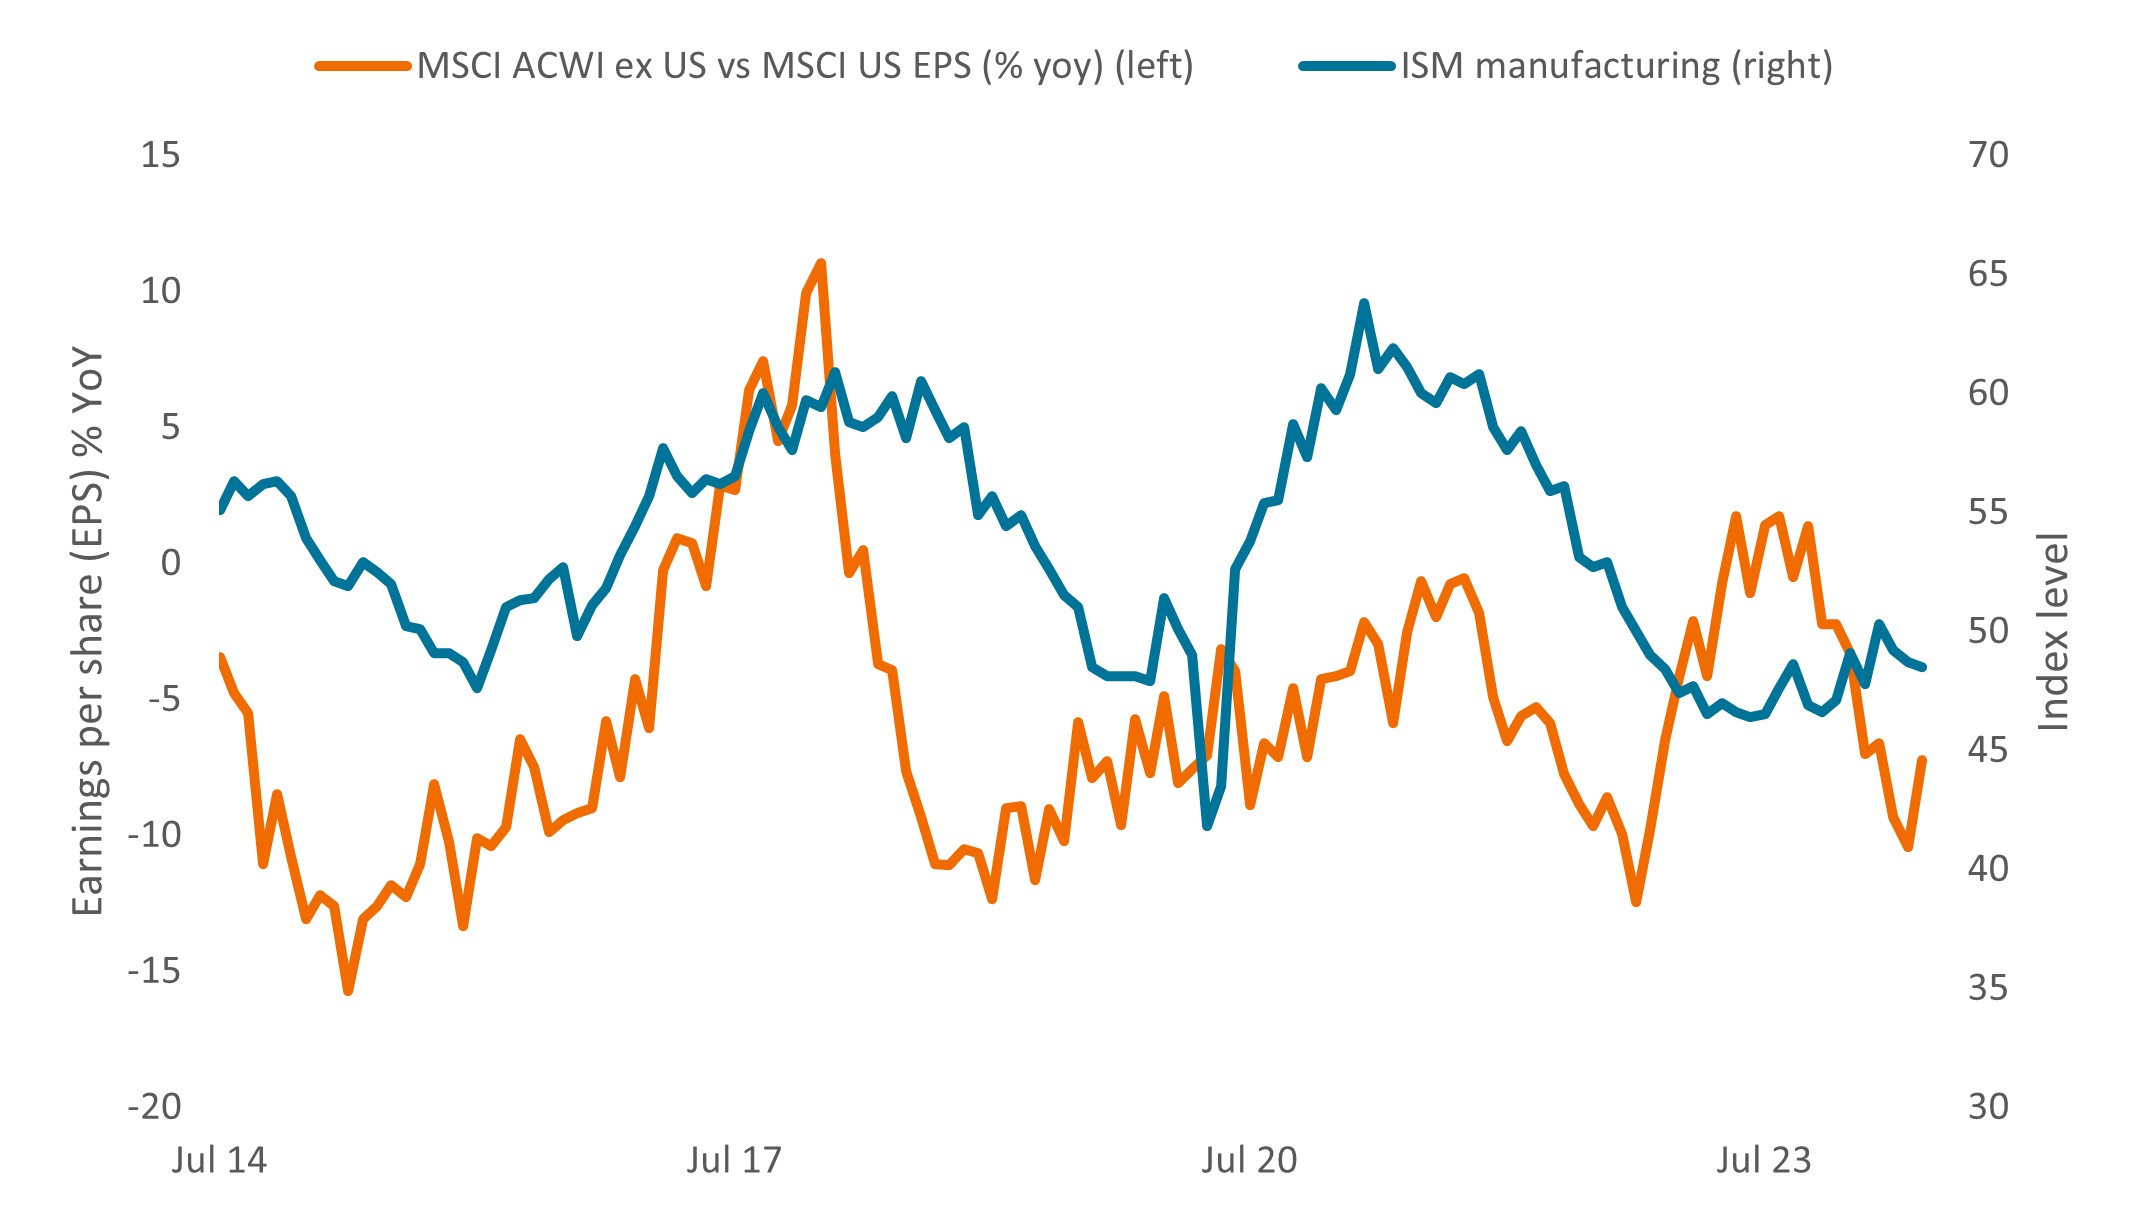
Source: LSEG/Datastream, from 3 July 2014 to 3 June 2024. Displays the positive relationship of manufacturing to higher earnings growth for non-U.S. stocks over U.S. stocks.
The third reason revolves around a familiar topic: valuation. The growing disparity in multiples between the U.S. and other parts of the world is often attributed to differences in benchmark composition. For instance, the information technology sector constitutes about 32% of the S&P 500 today in contrast to just 14% of the ACWI ex U.S. This disparity has significantly influenced index-level compound annual earnings growth, which has been notably higher for the S&P.
We contend that this comparison, based solely on sector composition, is not entirely sufficient. When conducting a sector-neutral analysis of price-to-earnings ratios, the rest of the world still appears to trade at a discount. The sustainability of this divergence in multiples remains to be seen over time.
 Source: LSEG/Datastream, from 30 June 2004 to 3 July 2024. Sector neutral comparison of 12-month forward price-to-earnings (P/E) ratio.
It’s important to highlight that the strength of the dollar has posed a considerable challenge for U.S.-based investors allocating assets internationally since 2011. Should the dollar cease its strengthening trend or begin to weaken – potentially as a result of the Federal Reserve moving toward rate cuts – this shift could serve as a significant catalyst for non-U.S. markets.
Many might find it surprising that, when the effects of currency fluctuations are excluded over the past three years, the MSCI EAFE currency-hedged index has actually outperformed the S&P 500 by nearly 1% annually.
Trailing three-year total annual return (%)
 Source: Morningstar, as of 30 June 2024. The MSCI World 100% Hedged to USD Index represents a close estimation of the performance that can be achieved by hedging the currency exposures of its parent index, the MSCI World Index, to the USD, the “home” currency for the hedged index.
After deciding to invest in stocks outside the U.S., the next crucial step involves determining the most effective allocation strategy. A common initial consideration for most allocators is whether to opt for active or passive management. Although this decision might be influenced by personal biases or convictions, historical data indicate that active management has generally achieved greater success in surpassing benchmarks compared to other markets. For instance, over the last decade, 64% of actively managed international funds have outperformed their respective benchmarks (Exhibit 5).
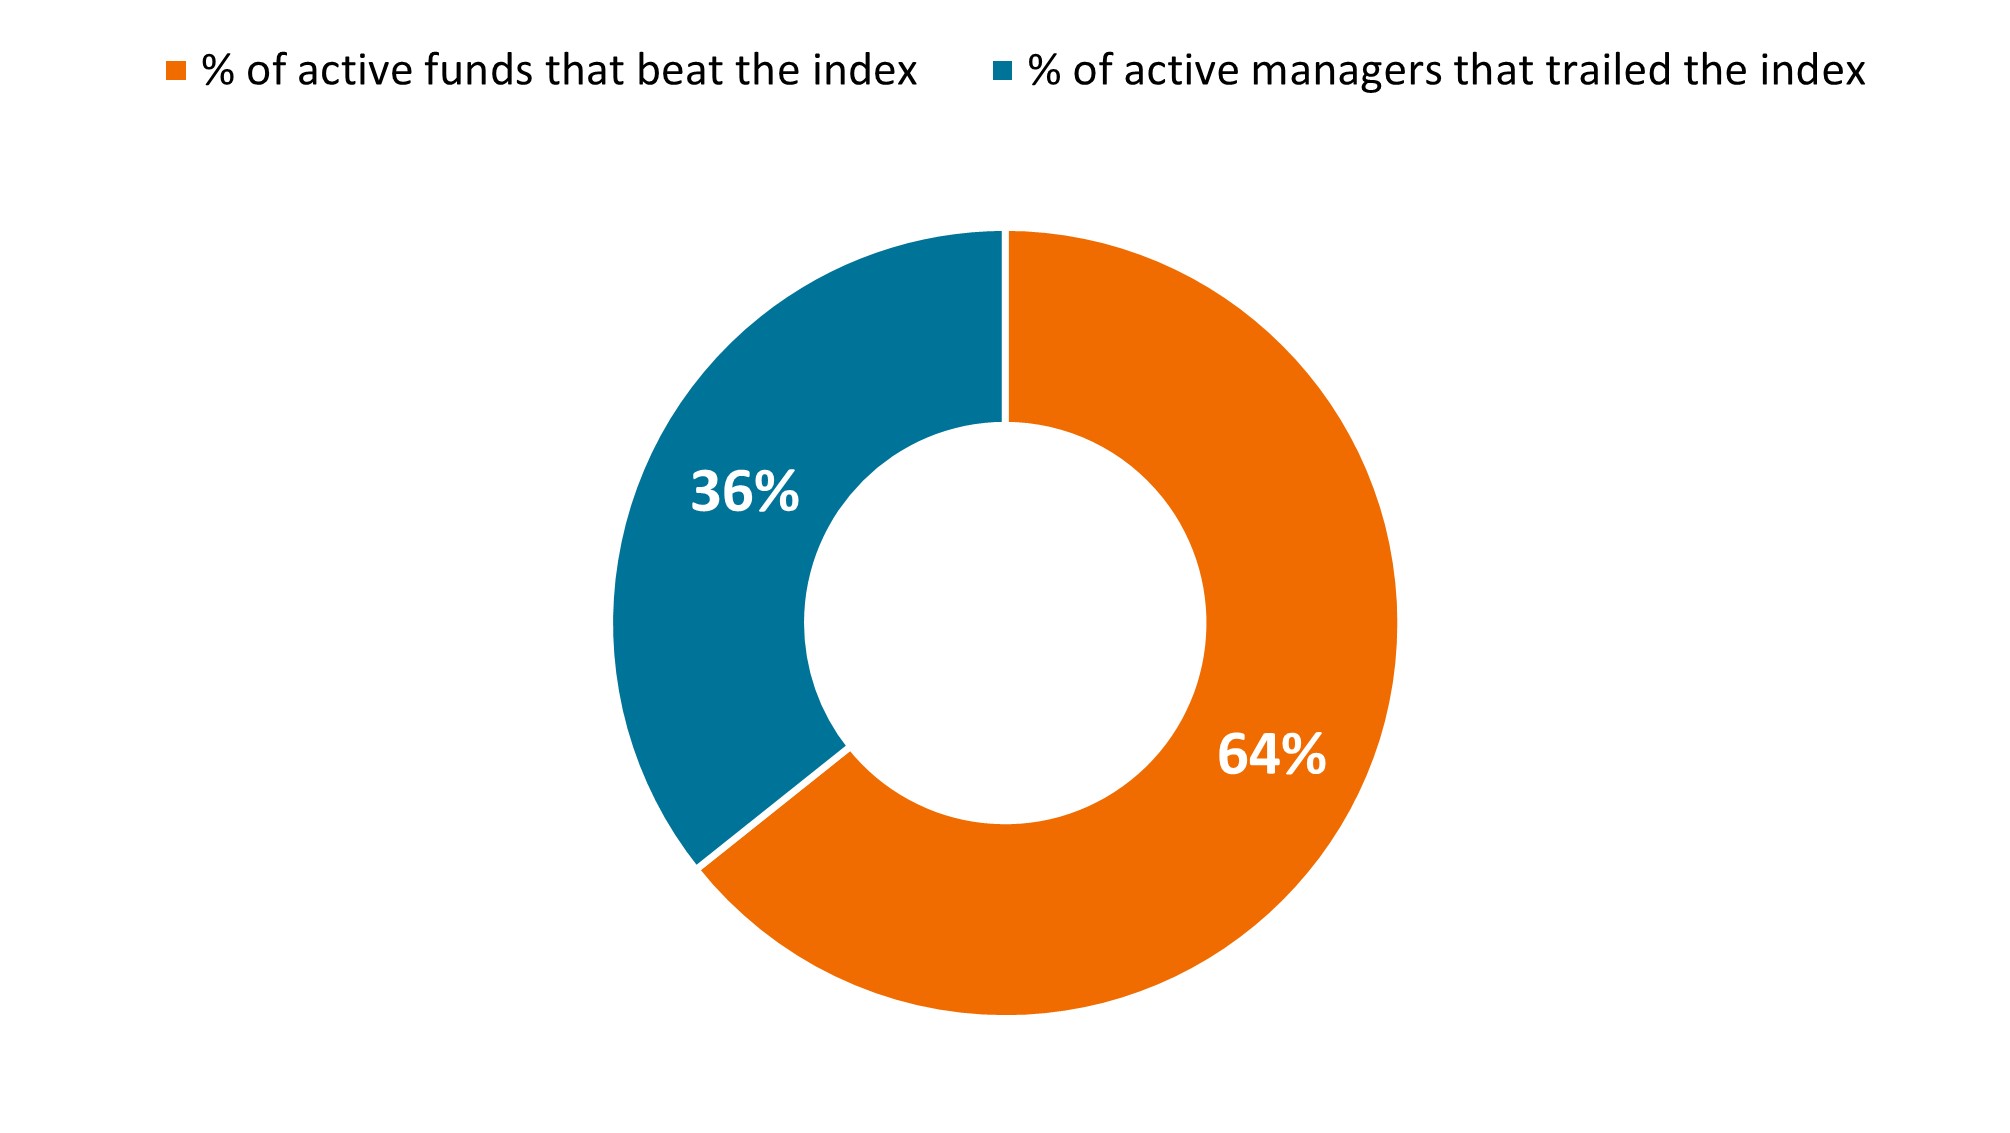 Source: Morningstar, from 1 July 2014 to 30 June 2024.
One common misstep that our team has observed involves portfolios incorporating international funds that fail to provide comprehensive diversification. While it’s true that the correlation between international and U.S. stocks has increased over recent decades due to the global expansion of companies, certain investment styles and categories still offer more diversification benefits than others. This point is not meant to advocate for any specific investment style; instead, it’s a call to action to ensure that your international investments genuinely enhance your portfolio by offering a distinct risk and return profile.
Rolling three-year correlation to the S&P 500
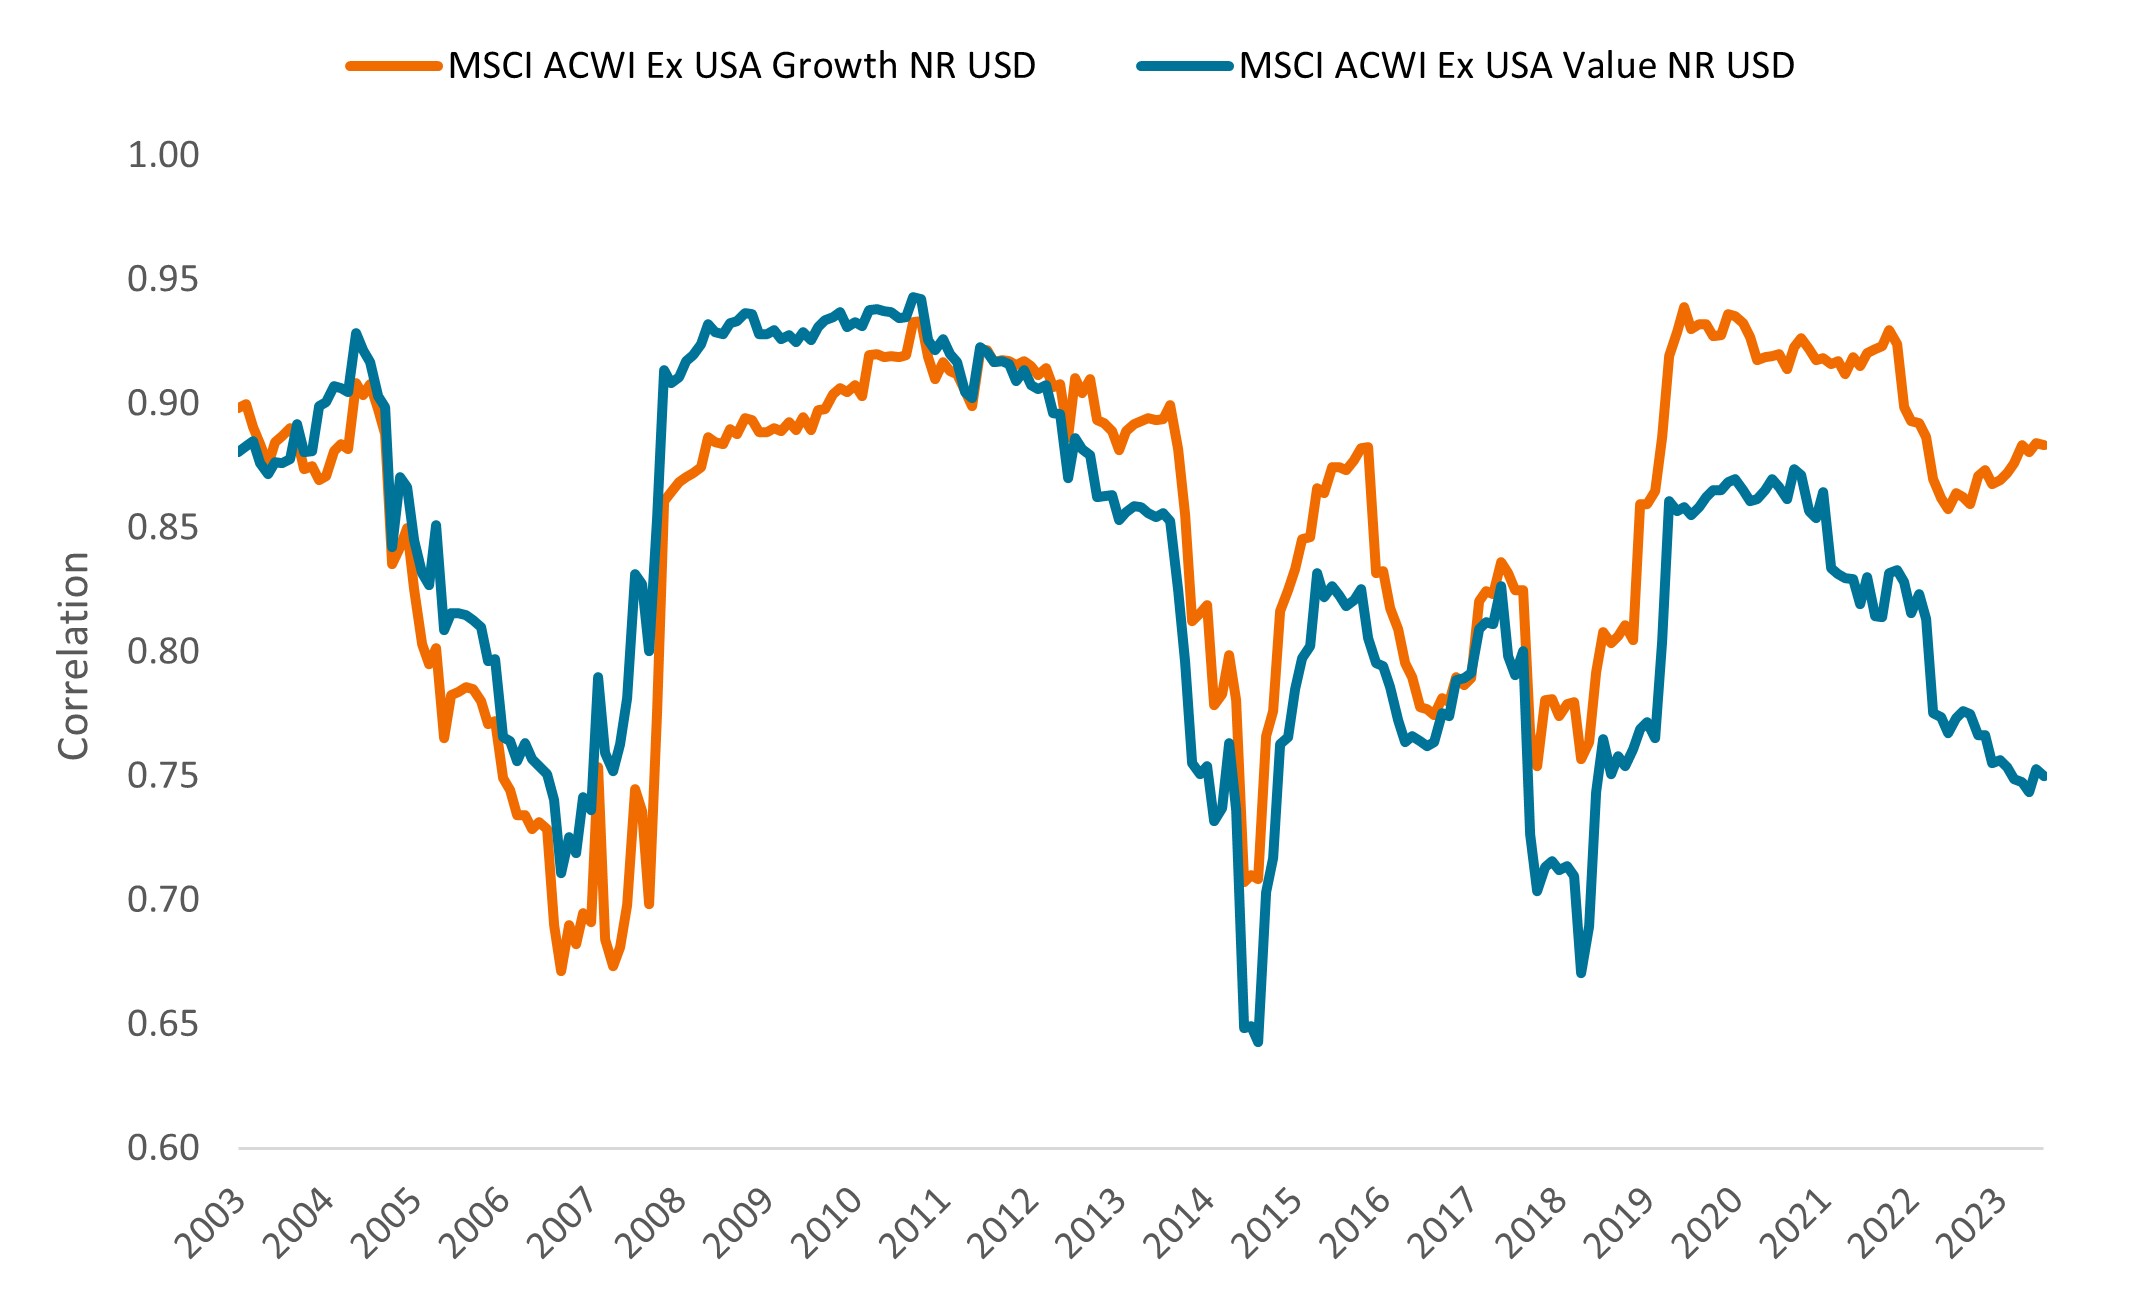 Source: Morningstar, from 31 December 2003 to 29 June 2024. The MSCI ACWI ex USA Growth Index captures large and mid-cap securities exhibiting overall growth style characteristics across 22 developed market countries and 24 emerging market countries. The MSCI ACWI ex USA Value Index captures the same pool of equities exhibiting overall value style characteristics. NR=net return.
We frequently encounter international funds that hold significant U.S. assets or have concentrated exposures to economic growth drivers similar to those of U.S. large caps, which usually play the biggest role in determining the risk and return dynamics of portfolios.
As we delve into the nuances of international investing, understanding the “why” and “how” sets the stage for addressing the crucial question of “who.” Selecting the right manager is more of an art than a science. While no strategy is foolproof, the following three tips can enhance your chances of choosing a manager who aligns with your investment goals:
Rolling success rates: Allocators often rely on static trailing returns when selecting funds, which can introduce significant biases related to specific starting and ending points. A more comprehensive approach involves examining a fund’s net results over various rolling time periods. This method offers a fuller picture of performance. Equally important is verifying that the current management team is responsible for the fund’s track record, ensuring continuity in decision-making and strategy.
Repeatable process: For actively managed equity portfolios aiming for consistent excess returns, it’s vital to have established sound methodologies and processes. Understanding how a manager achieves his or her results is key to building confidence in your choice and minimizing unnecessary turnover. We advocate for managers who take a disciplined approach to security selection, underpinned by thorough fundamental research, a focus on free-cash-flow growth, and the pursuit of unique insights, which we believe can yield superior risk-adjusted returns.
Prudent risk management: One of the primary goals for equity portfolio managers is to mitigate systemic market risks while showcasing their prowess in security selection. Familiarizing yourself with a manager’s risk budgeting guidelines and conducting risk attribution analysis can reveal managers who employ a thoughtful approach to portfolio construction. The aim is to identify those compensated for their skills in selecting securities rather than for taking diversifiable factor risks.
With these tips in mind, we believe you can improve your ability to select a manager who not only possesses the expertise to navigate the complexities of international markets but also aligns with your investment philosophy and objectives.
1 JHI Portfolio Construction and Strategy Team, as of 31 May 2024. Data are for U.S.-based advisors.
2 Statista, as of 31 December 2022. On a purchasing power parity basis.
3 Bloomberg, as of 30 September 2023.
4 Morningstar, JHI, as of 31 December 2023.
5 Contributed by Research Analyst Preksha Shah, CFA.
Correlation measures the degree to which two variables move in relation to each other. A value of 1.0 implies movement in parallel, -1.0 implies movement in opposite directions, and 0.0 implies no relationship.
Diversification neither assures a profit nor eliminates the risk of experiencing investment losses.
Foreign securities are subject to additional risks including currency fluctuations, political and economic uncertainty, increased volatility, lower liquidity and differing financial and information reporting standards, all of which are magnified in emerging markets.
Free cash flow (FCF) yield is a financial ratio that measures how much cash flow a company has in case of its liquidation or other obligations by comparing the free cash flow per share with the market price per share and indicates the level of cash flow the company will earn against its share market value.
MSCI EAFE® (Europe, Australasia, Far East) Index reflects the equity market performance of developed markets, excluding the U.S. and Canada.
MSCI All Country World ex USA Index℠ reflects the equity market performance of global developed and emerging markets, excluding the U.S.
MSCI USA Index℠ reflects the equity market performance of the U.S.
Purchasing Managers’ Index (PMI) is an index of the prevailing direction of economic trends in the manufacturing and service sectors, based on a survey of private sector companies.
Price-to-Earnings (P/E) Ratio measures share price compared to earnings per share for a stock or stocks in a portfolio.
Monetary Policy refers to the policies of a central bank, aimed at influencing the level of inflation and growth in an economy. It includes controlling interest rates and the supply of money.
S&P 500® Index reflects U.S. large-cap equity performance and represents broad U.S. equity market performance.
IMPORTANT INFORMATION
Active and passive investments may both lose value when valuations fall and market and economic conditions change.
Sign up for timely perspectives delivered to your inbox.