Subscribe
Sign up for timely perspectives delivered to your inbox.
Jenna Barnard and Dillan Shah from the Global Bonds Team discuss where they see bond yields heading using four analytical frameworks including their own historical analysis.

Throughout the course of this year, there has been a consensus that bond yields would not fall, even in a rate cutting cycle. Indeed, market pricing of 10-year bond yields in the future (according to the forward market) had been a linear extrapolation of where bond yields sat at that time. The message sent was that the benchmark 10-year government bond yield in the US (and similar in other countries) would not fall below their level at which they sat at that time, which for almost all of this year (in the case of the US) has been above 4%.1 The common-sense reaction would be a degree of incredulity – no asset class is expected to blithely sit at current levels over the coming years.
There were many narratives to support this view (often centred on the unobservable concept of term premium), but they fought the basic economic logic that without a decline in bond yields, interest rate cuts would not translate into the economy via declines in mortgage rates, corporate bond yields etc.
The more detailed pushback that we have tried to communicate is that this is also at odds with the long history of US bond market performance after the last rate hike. In all case studies right back to the late 1960s (and therefore capturing the secular bond bear market of the 1970s), 10-year yields have always declined materially from where they were at the date of the last rate hike. The starting point for the last rate hike in the US being 27 July 2023 when the yield on the US 10-year government bond was 3.87%. As a reminder, bond prices rise when their yields fall, so a decline in yield can offer a capital gain alongside income for the bond investor.
In the Figure 1 below, we illustrate how the 2023-2024 evolution in 10-year yields (dark grey) has progressed in the months after the last rate hike. Undoubtedly, it has followed a more painful and frustrating historical path to realising bond returns, i.e. the orange line, which is an average of performance in the three cycles from the late 1960s through to early 1980s. But it has tracked it remarkably well and the key point is even this path eventually converges with the much easier experience of the six cycles from 1984-2020 (in blue).
Figure 1: Change in US 10-year Treasury yield after last rate hike
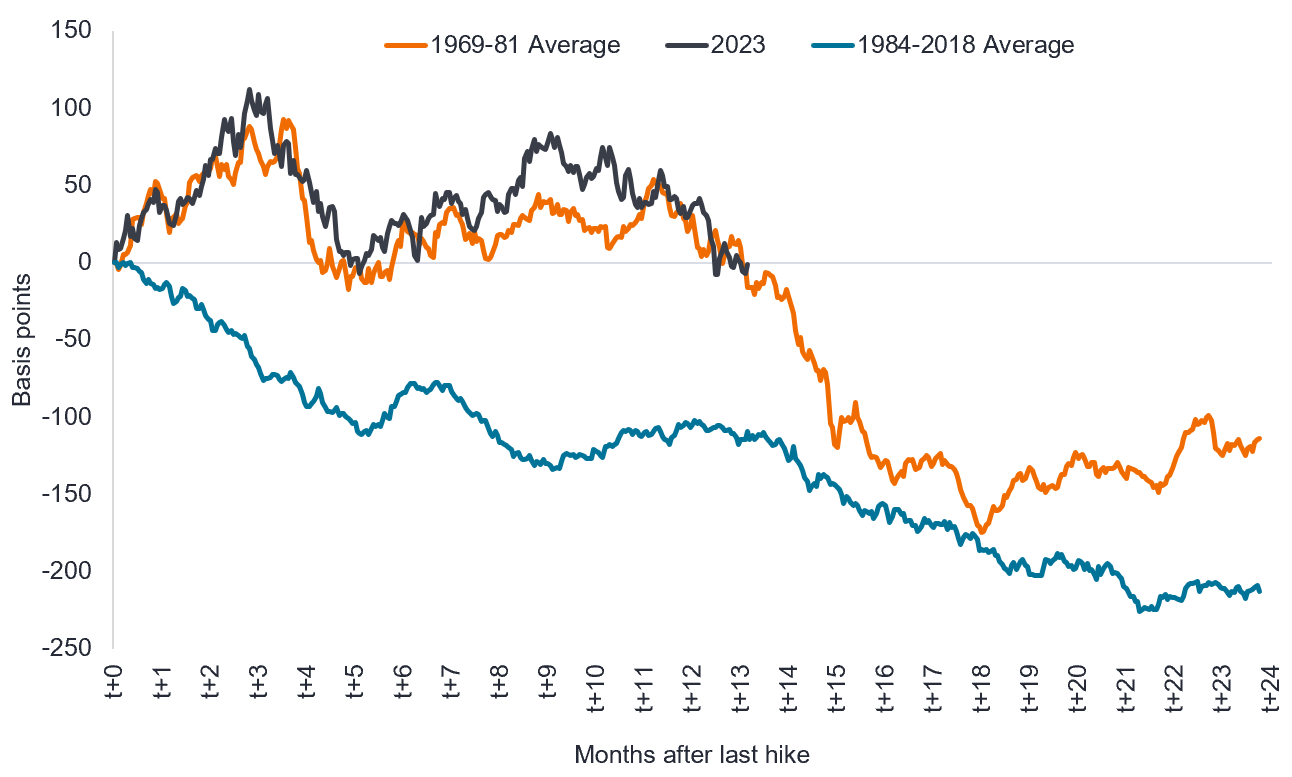
Source: Bloomberg, Janus Henderson calculations, as at 22 August 2024. Basis point (bp) equals 1/100 of a percentage point, 1bp = 0.01%. Past performance does not predict future returns. There is no guarantee that past trends will continue, or forecasts will be realised.
When we first presented this chart in January 2024, we clearly stated that the risk to this analysis was that we had not seen the last rate hike. Although the US Federal Reserve (Fed) were adamantly on hold, arguing that rates were restrictive and working, by April 2024 there were many loud voices arguing for no rate cuts in 2024. This has been put to bed by the recent four-month run of good inflation data and a weakening in the employment market, such that a September cut is now being signalled by the Fed who are increasingly focused on both sides of their dual mandate. The Fed is mandated to pursue two economic goals: price stability and maximum employment.
Today, bond yields sit at practically the same level that they reached at the beginning of this year and at the date of the last rate hike in July 2023.2 The purpose of this article is a brief update on this historical framework to assess to what level we, as a team, might reasonably expect the US 10-year government bond yield to fall to if it continues to track lower. Here we suggest several frameworks, all of which are based on what might be defined as a continuation of a soft landing (a controlled reduction in inflation that leads to a moderate slowdown in the economy). The conclusion is that we would target bond yields falling to a range of 3.25-3.75%. In a hard landing (a sharper contraction in the economy accompanied by rising unemployment), readers should assume much lower targets for 10-year yields, with bonds as an asset class providing an effective hedge to risk assets such as equities. The bear case remains that we have not seen the last rate hike, something which is looking increasingly unlikely.
Four potential frameworks:
Figure 2: US bond yields remain elevated relative to growth momentum
ISM New Orders versus yields differential

Source: Janus Henderson Investors calculations, Bloomberg, ISM New Orders Index and US 10-year government bond yield over rolling three years. January 1967 to August 2024. Yields may vary over time and are not guaranteed. Past performance does not guarantee future returns.
This article is intended to provide a basic roadmap for our thinking on where bond yields may decline to in a continuation of the current soft-landing narrative. As mentioned, we have had divergent views on the outlook for bond yields in a soft-landing versus the strong market consensus and forward pricing. Bond yields historically have always fallen after a rate hiking cycle has finished, whether a soft- or hard-landing. The key difference is that soft landings see less yield curve steepening and in some cases (1995) none at all.
As bond yields begin to converge with our viewpoint and the historical experience, we see some potential further downside to bond yields. With bond volatility falling and correlations to risk assets beginning to revert negative, bonds have an increasingly useful place in multi-asset portfolios. And if the probability of a hard-landing grows (unemployment is the key factor to watch here), the bond market would need to price this in to some extent, offering the prospect of further declines in bond yields and rises in bond prices.
IMPORTANT INFORMATION
Fixed income securities are subject to interest rate, inflation, credit and default risk. The bond market is volatile. As interest rates rise, bond prices usually fall, and vice versa. The return of principal is not guaranteed, and prices may decline if an issuer fails to make timely payments or its credit strength weakens.
There is no guarantee that past trends will continue, or forecasts will be realised.
Past performance does not guarantee future returns.
1The more detailed mechanics were that although shorter term, e.g. 2-year yields, were priced to fall somewhat over coming years, the consensus forward steepener that is also priced in, meant that 10-year yields were left unchanged in coming years.
2Source: Bloomberg, US 10-year government bond yield, 3.85% at 22 August 2024.
3Source: Bloomberg, US 10-year government bond yield, from 4 August 2020 to 22 August 2024.
10-Year Treasury Yield is the interest rate on US Treasury (government) bonds that will mature 10 years from the date of purchase.
Core Personal Consumption Expenditure (PCE) Price Index is a measure of prices that people living in the US pay for goods and services, excluding food and energy. It is a measure of inflation.
Default: The failure of a debtor (such as a bond issuer) to pay interest or to return an original amount loaned when due.
Disinflation: A fall in the rate of inflation.
Fibonacci retracement. This is a method of technical analysis (utilising predictive patterns in charts) that determines potential support and resistance levels. It is named after and derived from the Fibonacci sequence. Key levels are falls/rises of 23.6%, 38.2%, 50%, 61.8% and 78.6%. Fibonacci levels have been observed in nature and geometry and because many market followers pay attention to them there is an element of self-fulfilment. These levels should not be relied on exclusively, however, because the future is unpredictable.
Forward market: This is an over-the-counter marketplace that sets the price of a financial instrument or asset for future delivery.
Inflation: The rate at which prices of goods and services are rising in the economy. Core inflation typically excludes volatile items such as food and energy prices. A common measure for inflation is the Consumer Price Index (CPI).
Institute for Supply Management (ISM) New Orders Index: Also known as the purchasing managers’ index (PMI), is a monthly indicator of US economic activity based on a survey of purchasing managers at manufacturing firms nationwide.
Maturity: The maturity date of a bond is the date when the principal investment (and any final coupon) is paid to investors. Shorter-dated bonds generally mature within 5 years, medium-term bonds within 5 to 10 years, and longer-dated bonds after 10+ years.
Monetary policy refers to the policies of a central bank, aimed at influencing the level of inflation and growth in an economy. It includes controlling interest rates and the supply of money.
Purchasing Managers Indices (PMI) is a survey that acts as a leading insight into the prevailing direction of economic trends, based on the view of managers across different industries. The index is based on five indicators: new orders, inventory levels, production, supplier deliveries and the employment environment. The Institute for Supply Management (ISM) conducts a widely followed manufacturing PMI and Services PMI survey for the US.
Term premium: In standard economic theory, yields on Treasury securities are composed of two components: expectations of the future path of short-term Treasury yields and the Treasury term premium. The term premium is defined as the compensation that investors require for bearing the risk that interest rates may change over the life of the bond. Since the term premium is not directly observable, it must be estimated.
US Treasury securities are direct debt obligations issued by the US Government. The investor is a creditor of the government. Treasury Bills and US Government Bonds are guaranteed by the full faith and credit of the US government, are generally considered to be free of credit risk and typically carry lower yields than other securities.
Volatility: The rate and extent at which the price of a portfolio, security or index, moves up and down. If the price swings up and down with large movements, it has high volatility. If the price moves more slowly and to a lesser extent, it has lower volatility. The higher the volatility the higher the risk of the investment.
Yield: The level of income on a security over a set period, typically expressed as a percentage rate. For a bond, at its most simple, this is calculated as the coupon payment divided by the current bond price.
Yield curve: A yield curve plots the yields (interest rate) of bonds with equal credit quality but differing maturity dates. Typically bonds with longer maturities have higher yields. An inverted yield curve occurs when short-term yields are higher than long-term yields.
Sign up for timely perspectives delivered to your inbox.