Please ensure Javascript is enabled for purposes of website accessibility Horizon Japan Opportunities Fund - Janus Henderson Investors - Asia Singapore PI
For investors in Singapore

Horizon Japan Opportunities Fund

For investors seeking quality growth and cash-flow positive businesses with deep, local insight.

ISIN
LU0011889929

NAV
USD 22.34
As of 2024/12/20

1-Day Change
USD -0.10 (-0.45%)
As of 2024/12/20

Overview

INVESTMENT OBJECTIVE

The Fund aims to provide capital growth over the long term.

More

The Fund invests at least 80% of its assets in a concentrated portfolio of shares (equities) and equity-related securities of Japanese companies, of any size, in any industry.

Less

Note: You should not make investment decisions based solely on marketing materials. You should read the Prospectus and the Product Highlights Sheet of the Fund for more details of the investment risks and seek independent professional advice where appropriate.

ABOUT THIS FUND

LOCALISED INVESTMENT APPROACH
Experienced lead manager with local expertise and a proven track record, supported by a well-resourced firm.

NOT STYLE CONSTRAINED
Built on a foundation of quality, the fund also considers mispriced quality companies on an opportunistic basis.

HIGH CONVICTION
Repeatable, fundamentals-driven process, investing in a concentrated portfolio of profitable businesses demonstrating cash-flow growth.

Portfolio Management

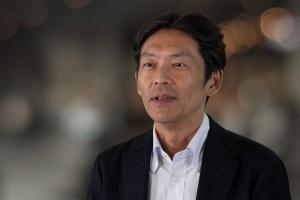
Junichi Inoue

Head of Japanese Equities | Portfolio Manager

Industry since 1995. Joined Firm in 2016.

Performance

Cumulative & Annualised Performance (%)
As of 2024/11/30
A2 USD (With Sales Charge)* Tokyo Stock Price Index (TOPIX) NR Japan Large-Cap Equity - OE A2 USD (Net)
 
  Cumulative Annualised
1MO 3MO 6MO YTD 1YR 3YR 5YR 10YR Since Inception
1985/07/31
A2 USD (With Sales Charge)* -4.13 -11.15 -7.54 2.20 6.64 0.04 4.41 6.18 3.87
Tokyo Stock Price Index (TOPIX) NR 0.90 -3.39 2.14 8.34 13.32 3.85 4.96 6.16 5.37
Japan Large-Cap Equity - OE 1.32 -3.79 2.50 8.06 12.87 2.39 4.56 5.80 5.71
A2 USD (Net) 0.91 -6.47 -2.68 7.58 12.25 1.76 5.48 6.72 4.01

Recommended holding period 5 Years

Example Investment: USD 10,000

Scenarios If you exit after 1 year If you exit after 5 years
MinimumThere is no minimum guaranteed return. You could lose some or all of your investment
StressWhat you might get back after costs1,820 USD2,120 USD
Average return each year-81.78%-26.68%
UnfavourableWhat you might get back after costs6,570 USD8,860 USD
Average return each year-34.35%-2.40%
ModerateWhat you might get back after costs10,470 USD12,610 USD
Average return each year4.71%4.74%
FavourableWhat you might get back after costs14,070 USD17,670 USD
Average return each year40.73%12.06%
Fee Information
Initial Charge 5.00%
Annual Charge 1.20%
Ongoing Charge
(As of 2023/06/30)
1.90%
Performance Fee 10% of the 'Relevant Amount'
Hurdle Rate Tokyo Stock Price Index

Portfolio

Top Holdings (As of 2024/11/30)
% of Fund
Toyota Motor 6.91
Sony Group 5.93
Hitachi 5.87
Sumitomo Mitsui Financial Group 5.56
Tokio Marine 5.06
Resona 4.65
Shin-Etsu Chemical 4.57
Fujitsu 4.52
Daiichi Sankyo 4.40
Shimizu 3.75

Documents