Outpacing money markets: The historical yield advantage of short-dated bonds
Portfolio Manager Daniel Siluk believes subsiding inflation and declining interest rates underpin a compelling argument for investors to reallocate funds away from money market strategies toward shorter-dated bonds.

9 minute read
Key takeaways:
- A record level of assets in money markets represents an opportunity cost to investors as they would be unable to participate in any potential capital appreciation within bond markets brought about by falling rates.
- An inverted yield curve and imminent U.S. policy rate reductions combine to present a compelling argument for a shorter-dated bond allocation.
- While an extended cycle favors higher-quality corporate credits, investors should practice vigilance when seeking out the sectors, credit quality and issuance with the most attractive valuations.
For months, financial markets have been eying the roughly $6.4 trillion parked in U.S. money market assets, hoping that a reallocation of just a portion of these funds would create a technical tailwind for stocks and bonds. The argument for the shift has merit now that inflation is receding, the next policy move is likely a rate cut, and the economic cycle has been extended. Still, we believe it would be overly optimistic to presume that cautious investors will materially increase exposure to the riskiest of asset classes.
This more circumspect view is based on cash offering relatively attractive yields for the first time in over a decade and fixed income investors’ memories of enduring double-digit losses during 2022 as inflation surged. Yet, for the reasons delineated above, a considerable portion of money market investors could feel the time is right to incrementally take on risk – but in a manner that doesn’t fully abandon their guarded mindset.
For those prioritizing low volatility, visibility, and a degree of capital appreciation not available within money markets, we believe a logical destination along the risk spectrum will be fixed income, namely the front end of the yield curve and the higher quality corporate credits that reside there. As the global economy exits a decade-plus era of price distortions – brought about first by highly accommodative policy and then the post-pandemic wave of inflation – we expect the relationship between short-duration bond and money market returns to revert to the historical norm, which would favor the former.
A matter of investor psychology – and policy largesse
In the past four years, the amount of assets under management in money market funds has doubled to nearly $6.5 trillion. There are both supply and demand components behind this increase. From the supply side, we can look to the pandemic era stimulus programs. Demand, on the other hand, is owed to the attractive yields on cash and lingering reticence to take on additional risk with inflation still elevated and the trajectory of the global economy not fully settled.
Exhibit 1: U.S. money market funds assets under management
A combination of fiscal largesse and investor hesitation after the bond market’s difficult 2022 has led to investors parking money in cash, despite the opportunity costs.
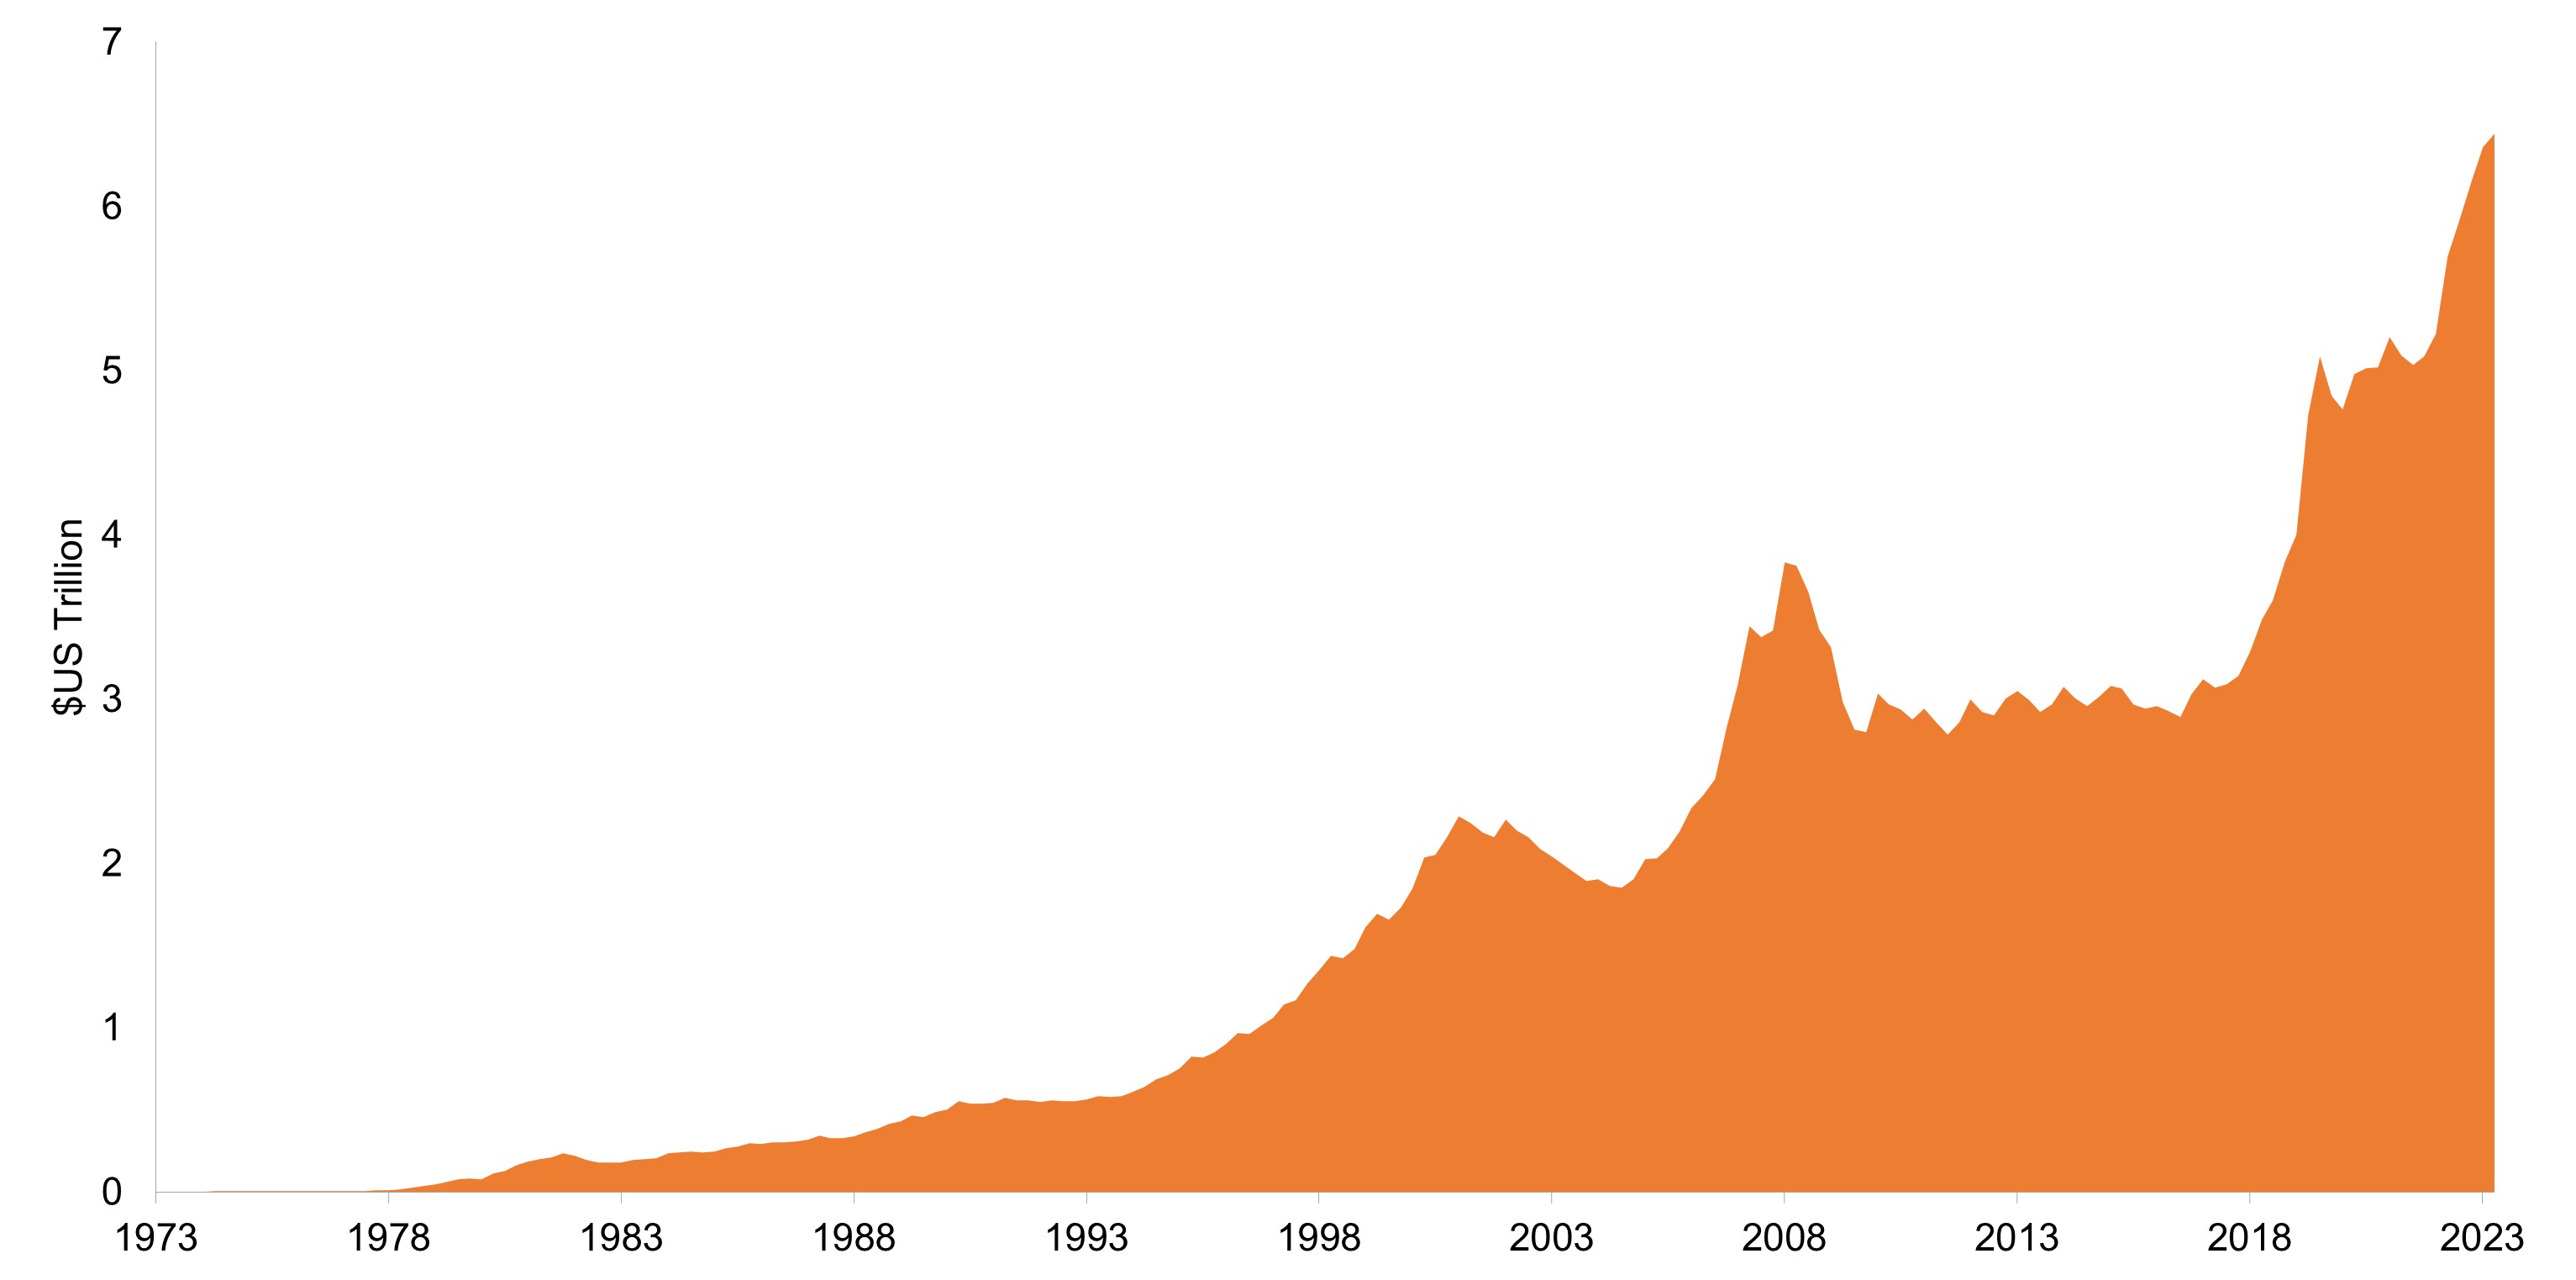 Source: Federal Reserve, as of January 2024.
The latter rationale has weakened in recent months as near-term economic and policy trajectories become clearer. With economic risk waning, we believe that an increasing number of money market investors will realize there is an opportunity cost associated with maintaining a large cash allocation – a fact brought home by resilient financial markets. While having a liquid rainy-day fund has its benefits, we believe the time is ripe for investors to deploy some cash back into capital markets, especially now that bonds once again offer attractive income streams, low volatility, and potential for capital appreciation.
In with the old
A shift toward short-duration fixed income could mark a return to the historical relationship between money markets and one- to three-year bonds. In the two decades preceding the COVID-19 pandemic, the market value of the Bloomberg U.S. Aggregate 1-3 Year Index consistently exceeded U.S. money markets’ assets under management by a considerable margin. The reason is simple: Since 1996, this index’s rolling one-year and three-year returns – calculated monthly – have outperformed money markets 75% and 84%, respectively.1 Even more compelling is that when policy rates are falling, shorter-dated bonds have always outperformed.
Exhibit 2: Time for mean reversion?
Over the past several economic cycles, shorter-dated bonds have typically outperformed money markets, with the trend even more pronounced during periods of falling policy rates.
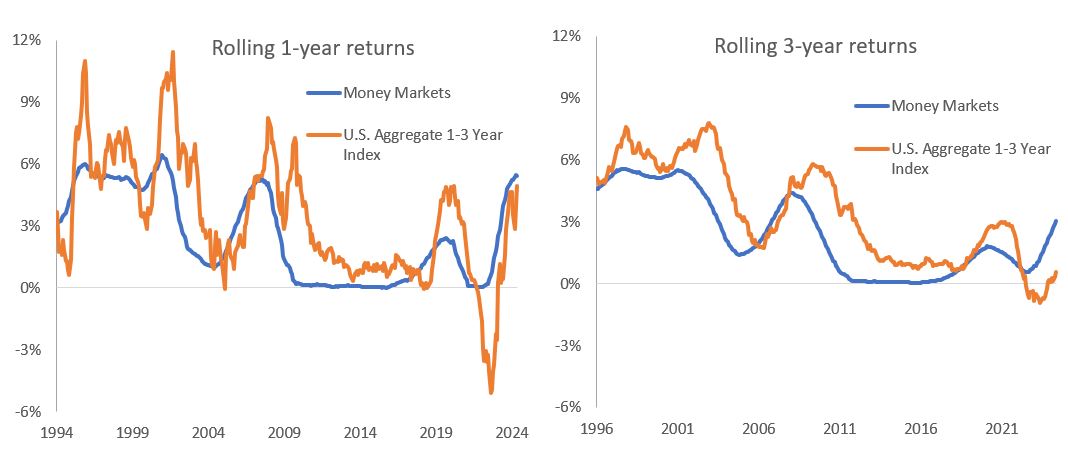
Source: Bloomberg, Janus Henderson Investors, as of 31 May 2024.
In our view, this historical relationship is well founded. A modest cash allocation is a useful tool for managing liquidity and keeping powder dry for future investment opportunities. But as illustrated above, in nearly all environments, for a slightly higher risk profile, investors have had the opportunity to generate returns exceeding those of cash.
Embracing the front end
Typically, the front end of the yield curve represents the least risky segment of the fixed income universe, as investors can more easily gauge inflation and other factors that may impact a bond’s value across the brief period until its maturation date. Although the roll down toward maturity usually results in a quantifiable income stream, yields on this segment of the curve are typically lower than longer-dated tenors, as investors trade higher returns for lower volatility. That, however, is currently not the case given the persistent inversion of the U.S. Treasuries curve.
Exhibit 3: U.S. Treasuries yield curve
Given the historic increase in policy rates as the Federal Reserve waged war on inflation, yields on shorter-dated securities have exceeded those of longer tenors, potentially offering bond investors higher returns in the part of the curve that has historically exhibited less volatility.
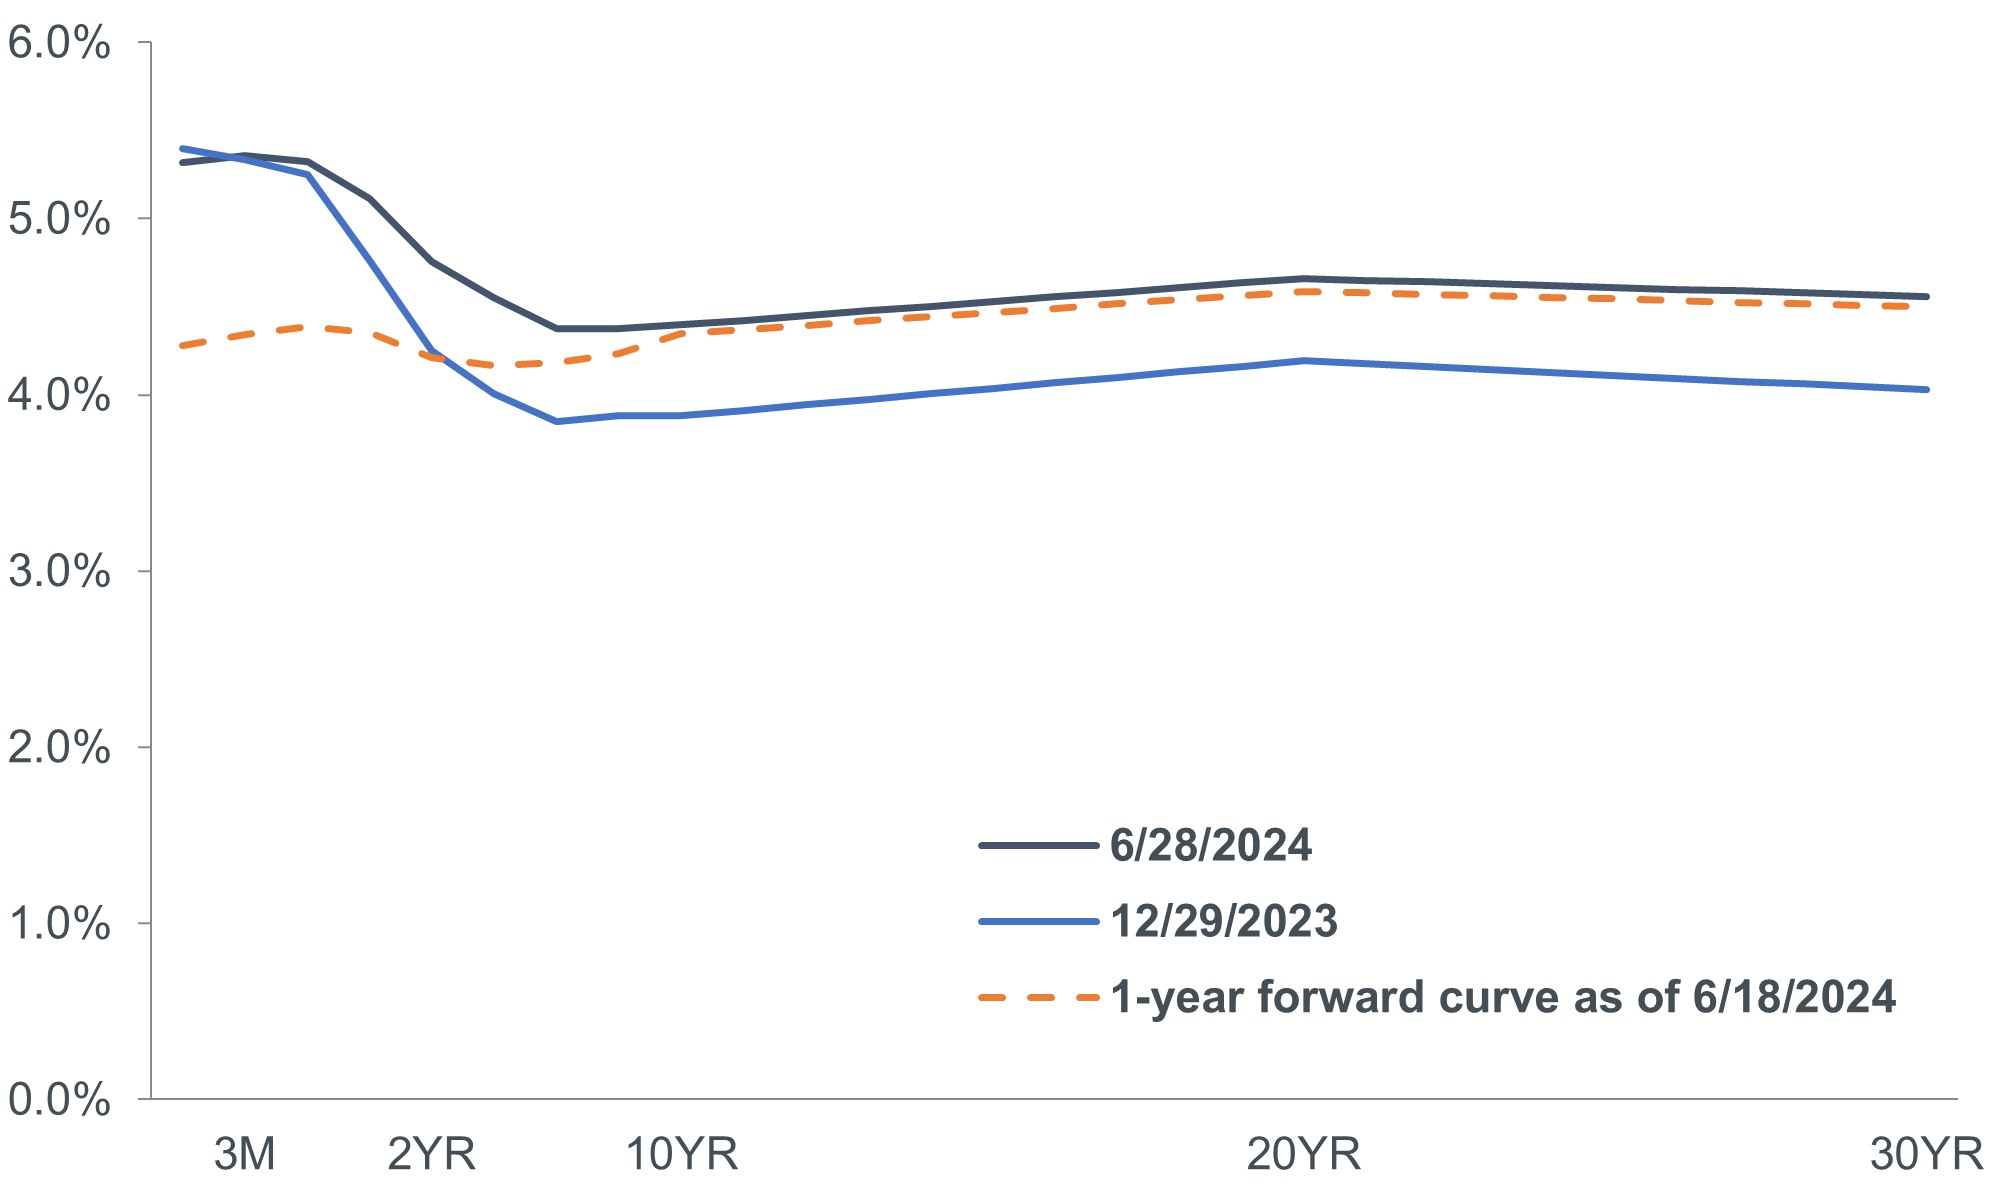 Source: Bloomberg, as of 30 June 2024.
For two years, shorter-dated notes have yielded more than longer-dated securities, meaning investors can potentially generate higher yields while being exposed to less interest rate risk, or duration. Furthermore, impending rate cuts in developed markets would likely result in the shorter-dated bonds that are more tethered to policy rates generating a degree of capital appreciation. Assets held in money markets would likely receive no such benefit – just lower yields on rapidly maturing short-term paper.
Investors must also remember that the liquid securities held in money market funds have maturities capped at slightly over a year. Should rates fall, the attractive yields of this year won’t carry into the next. In contrast, exposure to bonds with durations between one and three years will result in today’s yields proving more durable should the securities be held through maturity.
Clarity in credit
Another risk that’s easier to assess over the near-term horizon is the potential for a credit event. Even with this visibility, corporate credits typically trade at a discount to par, meaning that – similar to Treasuries – investors can often capture roll-down yield as these bonds near maturity.
A strategy premised on capturing this roll down cannot evade all credit risk. However, by focusing on higher-quality investment-grade credits, investors currently in money markets would have the ability to generate incremental yield without incurring much additional risk. Buttressing this approach is the relative strength of investment-grade balance sheets and corporations not facing a wave of refinancing for the next few years. Furthermore, recent new issuance of investment-grade credits has been oversubscribed, reinforcing strong demand for these securities.
One way to gauge the attractiveness of different segments of the bond market is to identify how much of an upward move in rates would wipe out a year’s worth of yield. While we don’t expect rates to rise, the exercise still provides insight into a bond segment’s relative value. Notably, both Treasuries and corporates with one- to three-year tenors have seen the historical relationship between yield and duration reemerge. Unlike for most of the post-Global Financial Crisis era, today’s shorter-dated notes generate sufficient yield to fend off all but the highest levels of rate volatility. Even with the resetting of yields, this is not the case for many longer-dated market segments.
Exhibit 4: Yield cushion on different bond market segments
With the historical relationship between yield and duration reestablished on the front end of the curve, investors once again have the potential to generate income commensurate with the associated level of risk.
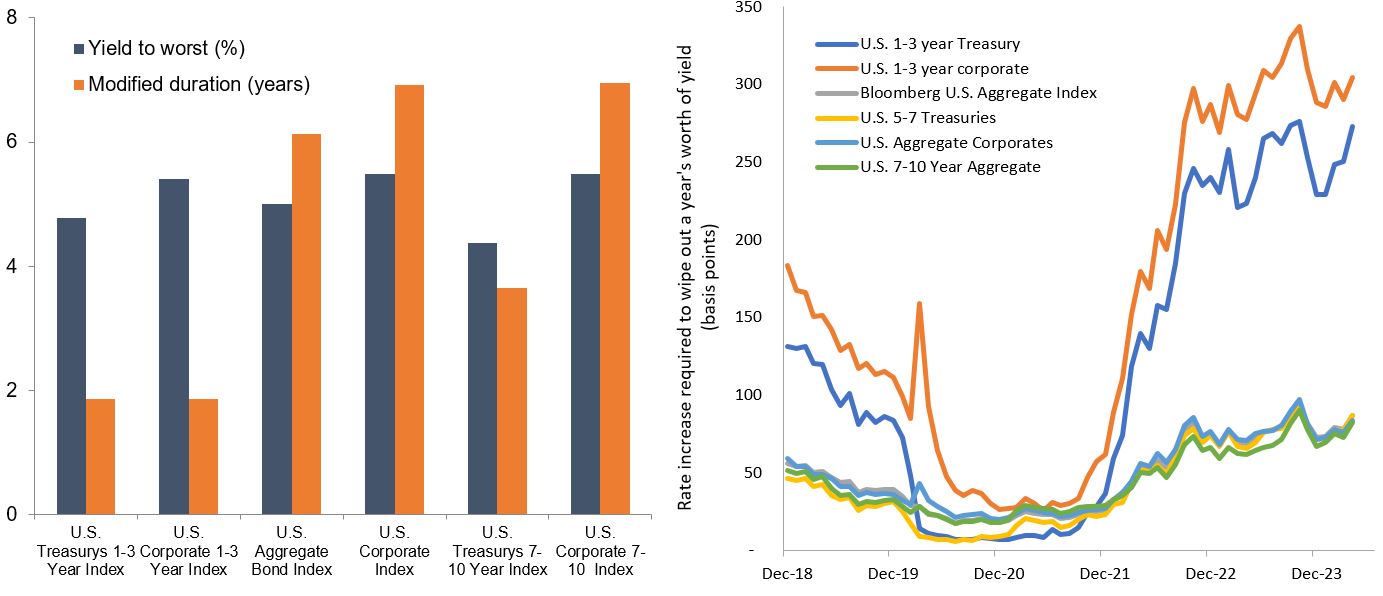 Source: Bloomberg, Janus Henderson Investors, as of 30 June 2024.
Another way to measure the relationship between risk and reward of different fixed income segments is the Sharpe Ratio. Over longer horizons, shorter-dated securities have exhibited higher Sharpe Ratios, indicating a more attractive trade-off between potential returns and underlying risk.
Exhibit 5: Sharpe Ratios of U.S. bond market maturity groupings
| Sharpe Ratio | |||
|---|---|---|---|
| 1-3 Year | 3-5 Year | 5-7 Year | 7-10 Year |
| 0.0054 | 0.0046 | 0.0040 | 0.0035 |
Source: Janus Henderson, as of 30 June 2024.
Over long time horizons, shorter-dated fixed income securities exhibit higher Sharpe Ratios, signifying a more attractive balance between return and incremental level of risk. Source: Janus Henderson, as of 30 June 2024.
The “right amount” of risk
The market volatility of the past several years gave investors plenty of reasons to consider an allocation to cash as it yielded substantially more than 0%. Yet the market and the global economy continue to evolve in a manner that weakens the argument for holding excessive cash. As is the case with money market strategies, shorter-dated bonds have also seen yields return to attractive levels. Unlike money markets, however, bonds have the potential to appreciate should developed markets continue to cut policy rates over the next several quarters, which is our expectation.
This appreciation is made possible by the extension of the economic cycle, which reinforces the case for taking on additional risk in a methodical manner. An extended cycle, however, is still possibly a late cycle. Given this, we believe quality should be prioritized, with well-capitalized investment-grade credits likely the more appropriate destination versus high-yield bonds or more speculative equities.
On the surface, valuations for higher-quality corporates appear rich based upon their yield relative to underlying benchmarks. This segment of the market, however, is not monolithic. Beneath these narrow spreads, we see considerable dispersion in valuations across sector, credit ratings, and even geography. The market volatility that we expect to continue as the eventual rate path becomes clearer exacerbates this dispersion, possibly creating opportunities for rigorous research to identify the individual securities that present the most attractive risk-reward proposition.
IMPORTANT INFORMATION
Bond prices generally move in the opposite direction of interest rates, thus bond prices may decline as interest rates rise, and vice versa.
Fixed income securities are subject to interest rate, inflation, credit and default risk. The bond market is volatile. As interest rates rise, bond prices usually fall, and vice versa. The return of principal is not guaranteed, and prices may decline if an issuer fails to make timely payments or its credit strength weakens.
1Source: Bloomberg, as of 28 June, 2024.
Bloomberg U.S. Aggregate Bond Index is a broad-based measure of the investment grade, US dollar-denominated, fixed-rate taxable bond market.
Credit Spread is the difference in yield between securities with similar maturity but different credit quality. Widening spreads generally indicate deteriorating creditworthiness of corporate borrowers, and narrowing indicate improving.
Duration measures a bond price’s sensitivity to changes in interest rates. The longer a bond’s duration, the higher its sensitivity to changes in interest rates and vice versa.
Roll down is the tendency of a fixed income security’s market price to approach its par value as it nears maturity.
Sharpe Ratio measures risk-adjusted performance using excess returns versus the “risk-free” rate and the volatility of those returns. A higher ratio means better return per unit of risk.
Volatility measures risk using the dispersion of returns for a given investment.
An inverted yield curve occurs when short-term yields are higher than long-term yields.
A yield curve plots the yields (interest rate) of bonds with equal credit quality but differing maturity dates. Typically bonds with longer maturities have higher yields.
Yield to worst (YTW) is the lowest yield a bond can achieve provided the issuer does not default and accounts for any applicable call feature (ie, the issuer can call the bond back at a date specified in advance). At a portfolio level, this statistic represents the weighted average YTW for all the underlying issues.
9 minute read
Key takeaways:
- A record level of assets in money markets represents an opportunity cost to investors as they would be unable to participate in any potential capital appreciation within bond markets brought about by falling rates.
- An inverted yield curve and imminent U.S. policy rate reductions combine to present a compelling argument for a shorter-dated bond allocation.
- While an extended cycle favors higher-quality corporate credits, investors should practice vigilance when seeking out the sectors, credit quality and issuance with the most attractive valuations.